【雅思小作文】组合图(曲线图+饼图)写作范例
组合图是雅思小作文里常考的题型之一,其写作非常值得我们深入研究。现专供一组合图(组合图+饼图或pie chart + line chart)写作范例和各位“雅友”一起分享,期望对大家的组合图写作带去一些启发和帮助。
不过,在鉴赏前还是请各位先看图表,并思考以下问题:
* 饼图和曲线图各自展示了什么数据在哪个时间点或段的变化特征?
* 在饼图中,数据总值为多少?它由几部分组成?每一部分各代表什么?各自所占百分比又是多少?百分比从大到小如何排列的?谁最大?谁最小?
* 曲线图有何特征?根据特征,曲线可以分成几段来描述?起点值、终点值、峰值、谷值多少?各自对应的时间点又是什么?
WRITING TASK 1:
雅思口语考试最新评分标准
雅思考试小作文—图表作文逻辑分析
雅思流程图作文—你不知道的秘密
雅思写作流程图的注意事项
如何在20分钟内写出不低于6分的雅思小作文
雅思流程图作文的注意事项
雅思零基础三个月创6分奇迹
You should spend about 20 minutes on this task.
* The chart and graph below give information about sales and share prices for Coca-Cola.
* Summarise the information by selecting and reporting the main features, and make comparisons where relevant.
You should write at least 150 words.
写作范文:
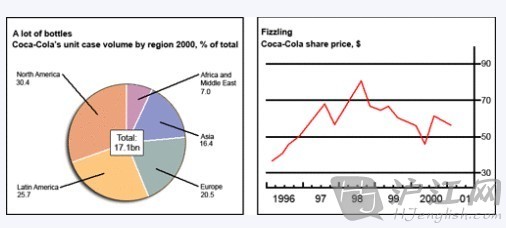
The pie chart shows the worldwide distribution of sales of Coca-Cola in the year 20## and the graph shows the change in share prices between 1996 and 2001.
In the year 2000, Coca-Cola sold a total of 17.1 billion cases of their fizzy drink product worldwide. The largest consumer was North America, where 30.4 per cent of the total volume was purchased. The second largest consumer was Latin America. Europe and Asia purchased 20.5 and 16.4 per cent of the total volume respectively, while Africa and the Middle East remained fairly small consumers at 7 per cent of the total volume of sales.
Since 1996, share prices for Coca-Cola have fluctuated. In that year, shares were valued at approximately $35. Between 1996 and 1997, however, prices rose significantly to $70 per share. They dipped a little in mid-1997 and then peaked at $80 per share in mid-98. From then until 20## their value fell consistently but there was a slight rise in mid-2000.
第二篇:雅思小作文饼状图写作范例、思路、常用句式
雅思小作文:饼状图一例
Manywomenwantorneedtocontinueworkingaftertheyhavechildren.Thechartbelowshowstheworkingaftertheyhavechildren.Thechartbelowshowstheworkingpatternofmotherswithyoungchildren.作文写作要点:
介绍各扇面及总体的关系。
各个扇面之间的比较,同类扇面在不同时间、不同地点的比较。
重点突出特点最明显的扇面:最大的、最小的、互相成倍的。
Thebasictrendsofthefourcharts:
Justafterbearingchildren,backtowork.
Theolderchild…themore…
Mostpart-timeduringchild5~9
Child10+,fulltimedouble,part-timeless
theintroductioncanbewrittenlikethis:
Evenjustafterhavingachild,alargenumberwomenreturntowork.Asthechildgrowsolder,thepercentageofmotherswhochooseorneedtocontinueworkingrises.Atleastuntilthechildisten,thelargernumberofworkingmotherstakepart-timeoccupations.Whenthechildistenyearsorolder,thenumberofthefull-timersmorethandoubleswhilethatofthepart-timersdecrease.
Eachchartentails/containsinstruction,whichillustrateswhatthechartinvolvesratherthantheovertrends.
WritingParagraphs:
Informationanalyzedaccordingtothepiecharts.
Child0~2,30%backtowork(19p.t.,
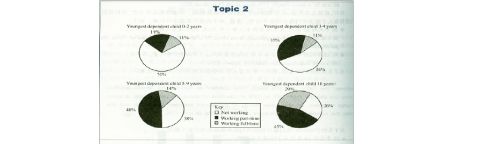
11f.t.)
3~4,p.t.updramaticallyto35%,f.t.same
5~9,p.t.upconsistentlyto48%,f.t.slightincreaseto14%
10+,p.t.slightly3%down,f.t.doubleto29%
Paragraph1:Whentheyoungestchildisatmost2yearsold,30%ofthewomenreturntowork.19%full-time,and11%aspart-timers.
Paragraph2:Thepercentageoffulltimersremainsthesameuntilthechildturnsfiveandincreasedslightlyto14%whenthechildisatmost9yearsold,butthepercentageofpart-timeworkingmothersgrowsdramaticallyto35andcontinuesgrowingto48%bythetimethechildis9.
Paragraph3:Achangeoccursafterthechildgrowstoten.Thenumberoffull-timeworkingmothersdoublesinpercentageto29,whilethatofthepart-timersisreducedslightlytoby3%to45%.
Conclusion:Itappearsthat,whenthechildturnstoten,womenhavemuchfewermaternalresponsibilitiesthantheyearsbefore.
SentencePatterns:
Introduction:
The(two)piechartsshow(reveal,suggest,illustrate,demonstrate,indicate,describe,relate)theproportion(percentage)ofAandB…in(7)(categories),dividedinto…and…(oneis…,anotheris…)
Comparison:
1、Thebiggestdifferencebetween(2)groupsisin…,whereAmakesup%while(whereas)Bconstitutes%(makesup=constitutes=accountsfor)
thehighestpercentage/amountofA,whichwasapproximately%,wasfor….(=in)/wasfoundin
2、ThepercentageofAin…ismorethantwicethepercentageofB,therationis%to%(%comparedto%)
3、In…,whilethereis(not)agreatdealofdifferencebetweenthepercentageofAandB(theformeris%andthelatteris%).
in…,whileagreaterpercentageofAthanBarefoundin…(theformeris%andthelatteris%).
4、TherearemoreA(in…),reaching%,comparedwith%ofB
5、Bycontrast,Ahasincreased(declined),from%in…to%in….
ComparedwithB,A…
Conclusion:
Tosumup
Inconclusion
Itappearsthat…
Thetwochartsclearlyshow…
-
雅思小作文曲线图常用模板
一雅思小作文曲线图写作步骤先根据横轴分析变化然后再进行比较第一段介绍核心信息eg时间地点研究对象一句话即可第二三段先分析第一个时间…
-
【雅思小作文】组合图(曲线图+饼图)写作范例
组合图是雅思小作文里常考的题型之一其写作非常值得我们深入研究现专供一组合图组合图饼图或piechartlinechart写作范例和…
-
雅思小作文曲线图写作技巧
最权威的国际教育服务平台雅思小作文曲线图写作技巧雅思小作文曲线图写作步骤先根据横轴分析变化然后再进行比较第一段介绍核心信息eg时间…
-
雅思考试小作文表格,曲线技巧及范文
小作文写作原则1客观不要猜原因不要做预测2准确roughlyapproximately3概括4详尽5多样词汇语法华丽审题步骤题目标…
-
雅思小作文之曲线图审题攻略
雅思小作文之曲线图审题攻略分享给考生朋友们想要取得雅思写作高分的话审题这个步骤是万万不能忽视的是影响写作分数的关键因素考生要在平时…
-
雅思小作文组合图范文和写作思路
今天环球雅思为正在备考雅思写作的考生介绍雅思小作文组合图范文和写作思路我们先从雅思小作文组合图范文开始雅思小作文组合图一Write…
-
雅思小作文饼状图范文
刚刚结束的12月21日雅思考试中小作文考到了柱状图和饼状图很多同学对于饼状图的写作并不是很有把握让我们一起来看看上海环球雅思写作老…
-
雅思小作文表格图攻略及范文
雅思小作文表格图攻略及范文类型纵向比较即自身前后的比较具有历史性可转为曲线图横向比较与其他同类事物的比较原则首句永远概括全部中间永…
-
雅思小作文范文--装置图 流程图 表格
小作文流程图Thegivengraphindicatestheproceduresofglassbottlerecyclebyth…
-
雅思小作文流程图步骤
雅思小作文流程图步骤流程图和其他数据图最大的区别在于流程图是纯文字的以描述为主属于说明文相比之下柱状图饼状图表格等数据图则需要对数…
-
雅思考试小作文表格,曲线技巧及范文
小作文写作原则1客观不要猜原因不要做预测2准确roughlyapproximately3概括4详尽5多样词汇语法华丽审题步骤题目标…