考研英语二 图表作文+范文++模板
考研英语图表作文范文
20##英语(2)大纲样题
48. Directions: In this section, you are asked to write an essay based on the following table, in which you should 1) describe the table and 2) state your opinions drawn from it.
You should write at least 150 English words.
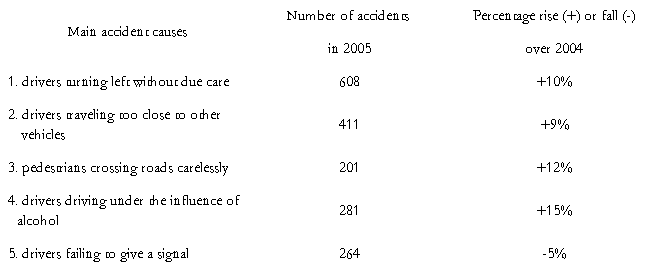
Accidents in a Chinese City (2005)
高分作文
The above is a table showing the vehicle-related traffic accidents in the year 2005, as is contrasted with those of the corresponding classes or categories in the previous year. There are 5 classes of vehicle-related accidents in the table, divided in accordance with the causes of the accidents. Of all the 5 classes of accidents, 4 have gone up, and only one goes down slightly, showing a worsening situation.
Of the classes of accidents that have gone up, the largest in scale of increase (15%) comes in the accidents caused by drivers who have drunk alcohol. Under the influence of alcohol, drivers are liable to lose their control or even consciousness, thus causing disasters. The total banning of alcohol from the drivers who are about to drive is in nature an action to save lives. Unfortunately, over four hundred pedestrians have become victims of traffic accidents due to their own carelessness. A conclusion can be easily drawn that strict observance of traffic laws and regulations, both drivers and pedestrians, is the precondition and a necessity of avoiding traffic accidents. Wheeled vehicles have been invented and produced as a help to human life, rather than a killer of human lives.
2011 (2)
Part B
48. Directions:
Write an essay based on the following chart. In your writing, you should:
1) interpret the chart and
2) give your comments.
You should write at least 150 words.
Write your essay on ANSWER SHEET2. (15points)
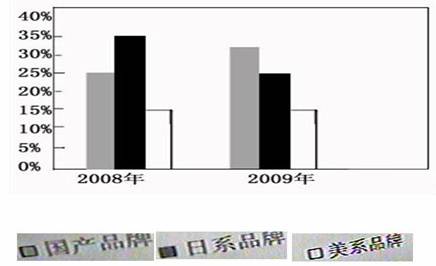
2008、2009年国内轿车市场部分品牌份额示意图
What is shown in the column chart above indicates that dramatic changes have taken place in the market share of certain brands in domestic car markets from 20## to 2009. During the period, there was a marked jump of 8% from 25% to 33% in the market portion of Chinese brands, while that of Japanese brands declined significantly by 10% from 35% to 25%. At the same time, the percentage of American brands remained steady.
There are at least two fundamental causes accounting for these changes. On the one hand, advancements in science and technology have offered a technical foundation for the rapid development of Chinese automobile industry by providing material basis and technical means. Meanwhile, it won’t be difficult to notice these days that national automobile companies in mounting numbers turn to price promotions to boost sales. On the other hand, the dishonest words and behaviors of Japanese automobile corporations such as Toyota in recent years cheapens their image and finally ruin their reputation.
To sum up, brands are insubstantial treasure. They are akin to a product’s or a company’s reputations. Obviously, if Chinese automobile industry wants to make continuous profits, what they need is to try promotions that reinforce Chinese brands’ image. (新东方 王江涛)
2010 (2)
48. Directions:
In this section, you are asked to write an essay based on the following chart. In your writing, you should
1) interpret the chart and
2) give your comments.
You should write at least 150 words.
Write your essay on ANSWER SHEET 2. (15 points)
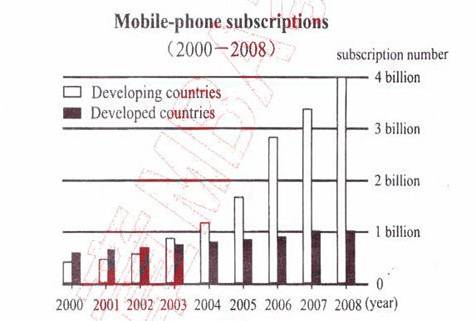
As is shown in the chart, mobile phone subscriptions grow rapidly from 20## to 2008. We can also find out that developing countries are the driving force for such a rapid growth. According to the chart, mobile-phone subscription number increased to 8 times from 20## to 2008, that is from around 0.5 billion to 4 billion, while subscription number only increased twice from around 0.5 billion to 1 billion.
I think there are two main reasons for such a great contrast.
First of all, developing countries have much larger population than developed countries. For example, China and India nearly have half of the total population of the world. China has the most mobile-phone users right now, which increased greatly from 20## to 2008. It is the same in India and other developing countries.
Secondly, developing countries have been enjoying strong economic growth in recent years. As a result, people in most developing countries are richer and richer, especially in China. So they can afford to buy such necessities, including mobile-phone, as the prices continued to drop greatly in the past years.
Thus, we can conclude that as economy grows strongly in developing countries, people in these countries can buy more products. (Total: 15; Score: 14)
1999
★ From these graphs, we can draw a conclusion that, with the growth of human population, the number of species has decreased rapidly in America, and some species have been vanished from our planet.
Why does this phenomenon appear? I think there are several possible reasons for this. First, with a rapid growth of population, more and more people came to live where some wild species have been living. Then these species have to move to other places. Some of them probably cannot adapt to the new environment and die. Second, although many people look on the wildlife as their friends, some people may not think so. They catch a lot of wild animals and sell them in order to get more money. Third, with the development of the industry, the natural balance and the ecologic environment are destroyed. The deforestation has become more and more serious. So some of the wildlives become homeless and extinct.
In order to protect the wildlife, I have some suggestions. First, the governments should make laws to prevent them being caught and killed. Second, the governments should educate people to love the nature and protect it. Third, as for ourselves, we should take practical actions to protect our living environment. (Total: 15; Score: 14)
★ As is shown by the two graphs, the U.S. population soared from 2 million to 250 million from 1800 to 1990. In contrast, the number of wildlife species no longer existing shot up, adding up to 70 over the same period of time. It is obvious that the extinction of wildlife resulted from the population explosion.
We may cite a variety of reasons for this situation. First of all, the destruction of ecological balance plays a pushing role. Due to population problem, pollution and desertification are becoming increasingly serious. Furthermore, a great number of species were killed for food, for money and even for fun. Evenworse, with the rapid growth of human population inhabitable areas were expanding so fast that few areas were for wild animals.
To sum up, it is imperative for us to take effective measures to protect wildlife. Firstly, the U.S. government should pour more investment into wildlife protection in a bid to create a better environment. Secondly, the birth rate in the U.S. must be put under control as the dramatically expanding population gives rise to serious environmental problems.
★ As is shown by the two graphs, it is obvious that with the rapid growth of US population from 1800 to 1900, the number of its wildlife species no longer existing soared during the same period. Naturally, we can draw the conclusion that the sharp decline of wildlife species resulted from the population growth.
We may cite a variety of reasons from this situation. To begin with, as the population grows, people consume much more natural resources, which often leads to excessive hunting. Furthermore, with the increase of human activities, modern people take up more and more space, which has a great impact on other species. Finally, the problem of pollution becomes more and more serious with the development of modern industry. More and more animals have to adapt themselves to the decaying environment or move to a totally different place, but not all of them are fortunate enough to survive the changes.
Solving this problem calls for, above all, the government’s efforts to control population growth, to decrease industrial pollution and to enhance the laws to forbid wildlife hunting. Moreover, common citizens should be aware of this ecological crisis and take on the responsibility of wildlife protection. In a word, only when the government and the common people make joint efforts can we hope to find a satisfactory solution to this problem.
1997
As is shown in the bar chart, the total production f tobacco in the world shrank from 14.364 billion pounds in 1994 to 14.2 billion pounds in 1995. According to the figures given in the pie chart, tobacco consumers account for 20% of the world population. This causes great harm to us. Financially, it results in a yearly loss of 200 billion US dollars spent on cigarettes. Physically, about 3 billion people on the globe die from smoking related disease every year.
Faced with such a threat, people from all walks of life have tried various measures for a total tobacco ban. For one thing, health experts try hard to warn the public of the dangers involved. Foranother, the authorities passed laws to limit tobacco production and consumption, raise tobacco taxes and prohibit smoking in public places. Moreimportantly, the public launch campaign to cut smoking.
On the basis of the analyses above, we can predict the future tendency confidently. With the further growth in economy and more changes in life style, the tendency of tobacco consumption indicated in the table will definitely decrease in the years to come.
★ We meet people everywhere: in the streets, on college campuses and in shops. There are 5.8 billion people in the world, and the smokers are about 1.1 billion, which makes up 20 percent of the world’s total population.
Smoking is very harmful. I think there are two main aspects to the damage. First, smoking consumes a great deal of money. As is shown in the pictorial graph, smoking wastes 200 billion dollars each year in the world. Second, smoking does harm to the health of smokers, and it is the main cause of lung cancer. About 3 million people die because of the relevant diseases derived from smoking every year.
Because more and more people are aware of the great harm of smoking to humans, the amount of tobacco consumption is on the decrease. From the following figures we can clearly see the tendency. The total amount of world tobacco production added up to 14.364 billion pounds in 1994, but it dropped to 4.2 billion pounds in 1995. At the same time, many countries call on people to give up smoking. So it is certain that the number of smoking is to decrease. (Total: 15; Score 14)
★ As is shown in the bar chart, the total production of tobacco in the world shrank from 14.364 billion pounds in 1994 to 14.2 billion pounds in 1995. According to the figures given in the pie chart, tobacco consumers accounts for 20% of the world population. Financially, it results in a yearly loss of 200 billion US dollars spent on cigarettes. Physically, about 3 million people on the globe die from smoking-related diseases every year.
Fortunately, the world tobacco production witnessed a decrease in recent years. According to this change, I confidently believe that there will be less and less tobacco consumption in the future, generally for two reasons. On the one hand, being aware of the harm of smoking, more and more people join in the fight against it. They either try their best to give up smoking or advise others not to smoke any longer. On the other hand, many governments have attached more attention to this social hazard and take various measures to put an end to it. Therefore, I have every reason to believe that the fight against smoking will be won by human beings at last.
作文模板
模版1
As is shown in the pictures, with the development of modern science and technology, . In one picture, . The caption reads, . On the contrary, . We are informed that .
The purpose of the pictures is to show us that due attention has to be paid to . If we let this situation go as it is, we do not know
will be in the near future. By that time, will suffer a great destruction.
Therefore, it is imperative for us to take drastic measures. For one thing, we should appeal to the authorities to make strict laws to control . For another, we should enhance the awareness of people that is vital to us. Only in this way can we . Also I believe that we humans can overcome this difficulty, and we will have a brighter future.
模版2
The set of drawings above vividly depicts . As is shown in the first picture, . The caption reads, . In the second picture, . We are informed that .
We can deduce from the table that due attention has to be paid to . The fact indicates that .
In my opinion, it is imperative to take steps to reverse the disturbing trend illustrated in the pictures. One measure would be . But more importantly, . Although the drive to fight against it is a long-standing and tremendous one, our joint efforts will eventually pay off. I believe that a happy and bright future is awaiting us if we make every effort to .
模版3
What is shown in the table (chart/graph) above indicates/ shows that drastic changes have taken place in . The statistics of rise and fall seem to exist in isolation but closely related to one another.
With the rapid advances in the living standard of the Chinese people in recent years, it has become common for people in many walks of life to . As an example of , we should remember that .
To crack this hard nut, people have worked out many effective measures. To begin with, . In addition, . More importantly, . Only in this way can .
模版4
The cartoon describes a very common phenomenon in our society that .
Why does this phenomenon appear/ take place/ arise? I think/ I’m convinced that there are several possible reasons for this. The first is that . Another major reason is . And studies show that another primary cause is . There is no denying that .
Having considered both sides of the argument, I have come to the conclusion that the advantages of outweigh the disadvantages. On the one hand, . On the other hand, . From this we can conclude that .
模版5
Through the pictures the author tries to warn us of the serious problem of
.
The main reason for my tendency to A is that 就理由进行解释 . For instance, . Another reason can be seen by every one is that 就理由进行解释 . For example, . The argument I support in the first paragraph is also in a position of advantage because .
Taking into account the factors above, we can safely draw a conclusion that
. Although I agree that there may be a couple of advantages of B, I feel that the disadvantages are more obvious, such as . In a word, . So it is sagacious to support the statement that it is better to A.
模版6
The cartoon ridicules/ criticizes some producers and companies that often . The picture reveals various problems in .
Depending on personal experience, personality type and emotional concern, we find that some people hold the idea of . Meanwhile, others prefer to . From my point of view, it is more advisable to choose rather than . My arguments for this point are listed as follows.
When the factors are examined, its advantages and disadvantages weighted, and biased opinions cast away, it is not difficult to draw the conclusion that .
模版7
The pictures indicate that there have been significant changes in in the last years. It can be seen in the picture that .
There is no denying that is the indication of civilization, progress and development; nevertheless, it causes the serious problem of . Scientists have warned that unless effective measures are taken, the problem of will eventually get out of hand. Actually, people are showing a real concern over the problem. For example, so as to prevent it from . Only in this way can we really solve the problem of caused by .
Indeed, the earth is our home and we have the duty to take care of it for ourselves and our descendants. In my opinion, we should work out concrete solutions to the problem of . For instance, . Only in this way can we really solve the problem of .
模版8
As is shown/ illustrated/ can be seen/ depicted/ described in the pictures, a number of . At the upper part of the picture there are some Chinese characters, which read “ ”.
We can deduce from this picture that the drawer is trying to attract our attention to the tragedy of , which is part of the threat to . He seems to be saying that . In my opinion, is a symbol of , including humans, and, like , we also will be left homeless if we allow the destruction of the environment to continue.
This simple picture is a wake-up call for the whole of the human race. If this vivid image of the grim future of our planet is not to become a reality, we must take positive steps right now to put an end to the plundering of the earth’s natural resources. It is clear that the drawer of the picture is urging us to start with a campaign to save , which is something all of us can join by urging our local authorities to take positive measures to protect .
模版9
As is shown in the picture/ table/ chart/ graph, .
As the saying goes, every rose has its thorn, and this issue is no exception. The majority of people would agree that . To judge this issue, we should look at three aspects.
From the analyses made above, we may come to the conclusion that . With the further growth in economy and more changes in life style, the tendency indicated in the table will continue in the better direction. Therefore, I’m convinced that will definitely decrease in the years to come.
-
20xx考研英语图表作文写作方法和模板
图表作文一第一节图表作文的类型图表作文可分为两大类表作文和图作文表作文表格Table可以使大量数据系统化便于阅读比较表格常由标题T…
-
20xx年考研英语作文万能模板:图表作文
考研英语大作文模板图表作文Thechartgivesusanoverallpictureofthe图表主题Thefirstthin…
-
考研英语二 图表作文+范文++模板
考研英语图表作文范文20xx英语2大纲样题48DirectionsInthissectionyouareaskedtowritea…
-
考研英语写作大作文范文及模板:图表作文
20xx12211151作者来源互联网字号TT摘要考研英语写作大作文范文及模板图表作文图表作文1写作攻略图表作文是考研英语写作中较…
-
20xx考研英语图表作文话题分类及范文
20xx考研英语图表作文话题分类及范文Topic9城里的月光初婚年龄持续走高注结婚话题来一个电视剧咱们结婚吧火了相亲节目一茬接一茬…
- 图表作文是考研英语写作中较为常见的题型之一
-
20xx年考研英语作文范文大全
20xx年考研英语作文真题范文大全20xx年全国研究生考试英语科目已结束作文地带第一时间对考研英语一及英语二大小作文真题进行了整理…
-
考研英语二_图表作文写作方法和模板_非常全(1)
考研英语之图表作文看图作文中的图表又可分为三种圆形图作文曲线图作文和条状图作文1圆形图圆形图Piechart也称为饼状图或圆面分割…
-
20xx年考研英语二作文预测范文十篇
20xx年考研英语二作文预测范文十篇时间20xx1216阅读7326来源新浪教育评论大中小划词已启用收藏1写作A节2写作B节一写作…
-
考研英语作文模板
对作文头痛的学弟学妹推荐一写作方法我是09年考的研现在在读研一英语考了七十多不高在做英语的时候时间也没有把握好两个作文只剩下半个小…
-
20xx年考研英语二作文命题规律分析
各位网友大家好,非常高兴又见面了。我是文都教育的王泉,那么今天利用这样一个机会,跟大家分享一下20xx年x月x日考研[微博]英语二…