雅思图表题作文_A类雅思各类图表作文
A类雅思各类图表作文要点及范文
一.曲线图
解题关键
1曲线图和柱状图都是动态图,解题的切入点在于描述趋势。
2在第二段的开头部分对整个曲线进行一个阶段式的总分类,使写作层次清晰,同时也方便考官阅卷。接下来再分类描述每个阶段的specific trend,同时导入数据作为分类的依据。
3趋势说明。即,对曲线的连续变化进行说明,如上升、下降、波动、持平。以时间为比较基础的应抓住“变化”:上升、下降、或是波动。题中对两个或两个以上的变量进行描述时应在此基础上进行比较,如变量多于两个应进行分类或有侧重的比较。
4极点说明。即对图表中最高的、最低的点单独进行说明。不以时间为比较基础的应注意对极点的描述。
5交点说明。即对图表当中多根曲线的交点进行对比说明。
6不要不做任何说明就机械地导入数据,这不符合雅思的考试目的。
曲线图常用词汇
动词—九大运动趋势
一:表示向上:increase,rise,improve,grow,ascend,mount,aggrandize,go up,climb, take off, jump,shoot up暴涨,soar,rocket, skyrocket
举例:人口上升:the number of population increased/ascended/mounted等等。
二:表示上升后保持平稳:flatten out(下降或升高后变平), level off
举例:人口上升后保持平稳:the number of population mounted and leveled off.
三:表示复苏(下降后再上升):recover,bounce back
举例:人口下降后复苏:the number of population decreased and recovered.
四:表示下降:decrease,decline,descend,drop, fall,go down,come down,collapse, crash, fall off, slump, plummet, plunge, slide,shrink, dwindle, diminish
举例:人口减少:the number of population decreased/ declined.
五:表示下降后保持平稳:bottom out,flatten out(下降或升高后变平)
举例:人口下降后保持平稳:the number of population decreased and bottomed out.
六:表示稳定或水平:remain steady/constant,stay stable, stabilize, stagnate,flatten out(下降或升高后变平), level off, stay at the same level, be similar to, there is little/hardly any/no change
举例:表示人口数量保持平稳的时候可以写: the number of population stayed stable. /the number of population remained steady.
七:表示波动:fluctuate
举例:人口波动:the number of population fluctuated.
八:表示在底部:reach a low point,bottom out,reach the bottom,reach the rock,hit a trough
九:表示在顶部:reach a peak,peak,top out,reach the highest point/ the top/ the summit/ the most,peak in/at,reach the zenith
举例:人口到达了顶峰:the number of population peaked/ reached its summit/ reached its zenith.
形容词和副词—变化程度
abrupt(ly)(突然),sudden(ly)(突然),dramatic(ally)(急剧),drastic(ally)(急剧),sharp(ly)(急剧),quick(ly)(迅速),rapid(ly)(迅速),marked(ly)(显著),significant(ly)(显著),considerable(considerably)(相当),substantial(ly)(相当) moderate(ly)(适当),gradual(ly)(逐渐),slight(ly)(轻微),slow(ly)(缓慢),steady(steadily)(平缓)
名词
line chart线图,curve diagram曲线图,horizontal axis横轴,vertical axis纵轴,plateau(上升后的稳定期),record high历史高度,record low历史低点,trough (曲线上的)最小值,zenith(最高值), general trend,upward/downward tend
增加:an increase,a rise,a growth, an improvement, an upturn, a surge, an upsurge, an upward trend
下降:a fall, a decrease, a decline, a drop, a downturn, a downturn trend,low point,reduction
波动:fluctuation
介词
一. remain steady/ stay stable/ level off/ bottom out/ peak/reach its peak/ reach its zenith后面需要使用的是at.
举例: 1.人口在500万上保持平稳: The number of population remained steady at 5 million.
2. 人口在800万时到达了顶峰: The number of population peaked at 8 million.
3. 下降后,人口在400万保持平稳:After decreasing, the number of population bottomed out at 4 million.
4. 上升后,人口在700万保持平稳: After mounting, the number of population leveled off at 7 million.
二. 上升/下降后面使用to(到)和by(了)
举例:
1. 人口下降到200万: number of population decreased to 2 million.
2. 人口下降了200万: number of population decreased by 2 million.
3. 人口上升到1000万: number of population increased to 10 million.
4. 人口上升了500万: number of population increased by 5 million.
三. recover的后面大家需要使用的是from
举例: 人口在200万时开始复苏: The number of population recovered from 2 million.
四. fluctuate的后面大家需要连接between …and…
举例: 人口在20和100亿之间波动: The number of population fluctuated between 2 and 10 billion.
曲线图常用表达
开头概述常用表达
1) The line chart depicts the changes in the number of _____ over the period from 20## to 2004.
该曲线图描述了从20##年到20##年_____数量的变化。
2) The chart provides some data regarding the fluctuations of _____ from 20## to 2004.
该曲线图描述了从20##年到20##年_____的变动。
3) The graph,presented in the curve diagram,shows the general trend in _____.
该图以曲线图的形式描述了_____总的趋势。
4) This is a line chart showing _____.
这是一个曲线图,描述了_____。
5) As can be seen from the graph,the two curves show the fluctuations of _____.
如图所示,两条曲线描述了_____波动的情况。
描述曲线常用表达
1)The _____ in the graph is measured in units,each of which is equivalent to _____.
图表中的_____以_____为单位,每单位等于_____。
2) The horizontal axis stands for _____.
横轴代表了_____。
3) The vertical axis stands for _____.
纵轴代表了_____。
4)There was a rapid (/dramatic/drastic/sharp/great/remarkable/slight/little/slow) increase (/rise/decrease/drop/fall/decline) of A over the period from _____ to _____.
从_____到_____期间A有快速 / 剧烈/急速/很大/明显/很小/几乎没有/缓慢地增长/下降。
5) The curve appeared to level off in 1988.
曲线似乎在1988年稳定下来。
6) The situation reached a peak (/high point) at _____ in 2000.
这种情况在20##年到达一个顶点,为_____。
7) The situation fell down to (/reached) the bottom in 2000.
这种情况在20##年降到低谷。
8) The figures hit a trough in 2000.
这些数字20##年降到最低点。
4.5.3.5曲线图模板
The line chart compares the rate of A and B . It can be clearly seen that _____.
A _____. In contrast,B _____.
In conclusion, we can see from the chart that _____.
范文
You should spend about 20 minutes on this task.
The graph and table below give information about water use worldwide and water consumption in two different countries.
Summarise the information by selecting and reporting the main features, and make comparisons where relevant.
Write at least 150 words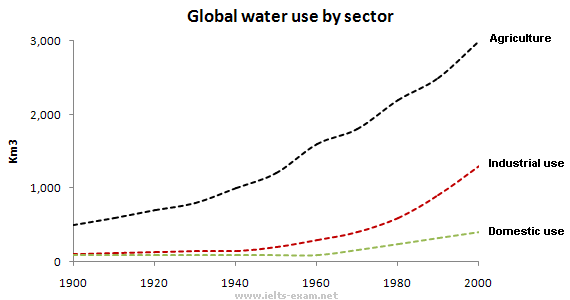
 1.png (6.19 KB)
20##-6-17 10:59
model answer:
The graph shows how the amount of water used worldwide changed between 1900 and 2000.
Throughout the century, the largest quantity of water was used for agricultural Purposes, and this increased dramatically from about 500 km³ to around 3,000 km³ in the year 2000. Water used in the industrial and domestic sectors also increased, but consumption was minimal until mid-century. From 1950 onwards, industrial use grew steadily to just over 1,000 km³, while domestic use rose more slowly to only 300 km³, both far below the levels of consumption by agriculture.
The table illustrates the differences in agriculture consumption in some areas of the world by contrasting the amount of irrigated land in Brazil (26,500 km³) with that in the D.R.C. (100 km²). This means that a huge amount of water is used in agriculture in Brazil, and this is reflected in the figures for water consumption per person: 359 m³ compared with only 8 m³ in the Congo. With a population of 176 million, the figures for Brazil indicate how high agriculture water consumption can be in some countries.
(180 words)
二.流程图
解题关键
流程图flow charts是一个难点。流程图的题目基本不会重复;流程图的词汇随着图表不同而变化,很少出现重复的词汇。幸运的是,流程图考题次数并不多,一年大概三到五次,主要集中在年初年末三个月。
流程图特点:
1流程图基本不会出现数据,文字信息占主要地位;
2流程图以描述为主,比较的机会比图表题少;
3流程图中出现的信息都需要描述,而普通图表则不需要描述每一个数据;
4流程图的时态多比较单一,主要用一般现在时;
5流程图的分段比较灵活,只要不同阶段之间的差距很明显,就可以另起一段。
描述流程五大步
1首先说明该过程是做什么工作的,目的是什么。
2准备工作。
3按时间/过程先后描述。
4结果。
5简单总结(可有可无)。
描述一个实物/器具的工作过程
1实物是什么,做什么用的。
2基本结构。
3工作过程。
4简单总结。
扩充内容的关键:阶段间进行比较
很多烤鸭们在流程图写作中经常遇到字数不够的问题,这是由于描述过程太平铺直叙。此时要注意各个阶段的比较。
例:In two weeks,the fry will grow up to two inches long.
解析:原句过于简单,可以增加鱼苗和前一阶段的比较。
改正:In two weeks, the fry will grow up to two inches long, more than twice longer than it was when hatched.
大意:在两周的时间内,鱼苗长到了两英寸,比刚孵化的时候长两倍还要多。
例:In the second step,workers will rinse bottle glass of any colour.
解析:原句过于简单,可以增加一点说明,譬如说关于第二阶段产生的变化和结果。
改正:In the second step,workers will rinse bottle glass of any colour.While the glass in the first phase is possibly life-threatening and contaminated,the glass is now hygeian and ready for the next stage of the recycling process.
大意:在第二步,工作人员会清洗各种颜色的玻璃。第一阶段的玻璃可能是危害健康并被污染的,而这一阶段的玻璃是卫生的,可以为循环过程的下一步做准备。
例:In the second phase of urban sprawl,land developers start to build a residential area.
解析:原句过于简单,可以增加一点说明,譬如说关于第二阶段的功能和目的。
改正: In the second phase of urban sprawl,land developers start to build a residential area.It is to serve the needs of those people working in those office blocks and factories built in the first phase.
大意:在城市扩张的第二阶段,土地开发商开始建造居民区。这是为了满足在第一阶段所建办公楼和工厂里工作的人们的需要。
范文
You should spend about 20 minutes on this task.
The flowchart illustrates the production of coloured plastic paper clips in a small factory.
Write a report for a university tutor describing the production process.
Write at least 150 words.
model answer:
There are four main stages in the production of plastic paper clips from this small factory. Two of these stages involve actual preparation of the clips, while the other two consist of quality control before the clips are sent out from the factory to the retailers to be sold to the public.
To begin with, molten plastic is poured into three different moulds depending on the colour required; the colours are red, blue and yellow. Once these clips emerge from the moulds a quality control machine checks them for strength. Unsatisfactory clips are rejected. In the third stage in the process the clips are stored by hand into two groups, mixed and single colours. When this stage is complete the groups are checked a second time to ensure that the colour mixtures are divided correctly into single colours and mixed colour batches. Finally, the clips are packed and dispatched to the markets.
(152 words)
三.表格类
解题关键
1表格与饼图一样,都是静态图。切入点在描述分配;
2表格题考查列举数字的能力和方法。通过举一些有代表性的数据来说明问题;
3横向比较。介绍横向各个数据的区别、变化和趋势;
4纵向比较。介绍纵向各个数据的区别、变化和趋势;
5不需要将每一个数据分别说明,突出强调数据最大值和最小值;
6对比时要总结出数据对比最悬殊的和最小的。
表格类作文常用词汇
noticeable trend 明显趋势
pronounced adj. 明显的
significant changes一些较大变化
rank n. vt. vi. 列为,排列,等级
distribute vt. 分布,区别
unequally adv. 不相等地
average n. vt. vi. adj. 平均
corresponding adj. 相应的,通讯的
represent vt. 阐述,表现
overall adj. 总体上讲
in the case of adv. 在...的情况下
in terms of / in respect of / regarding 在...方面
表格常用表达
开头概述
1) The table shows (reveals,illustrates,demonstrates,depicts,describes,indicates) _____.
2) According to the table, _____.
3) As (is) shown in the table, _____.
4) As can be seen from the table, _____.
5) Figures/statistics show (that) _____.
6) It can be seen from the figures/statistics that _____.
7) It is clear from the figures/statistics that _____.
8) It is apparent from the figures/statistics that _____.
描述比例
1) _____ accounts for (takes up) 20% of all.
_____占总数的20%。
2) On the top of the list is _____, which accounts for 70%.
比例最高的是_____,占70%。
3) At the bottom of the list is _____,which takes up 20% only.
比例最低的是_____,仅占20%。
4) A ranks first,followed by B at 20% and C at 15%.
A占比例最大,其次是B占20%及C占15%。
5) The figure reached the highest/lowest point in _____.
数据在_____时候达到最高点(最低点)。
描述对比
1) A has almost (nearly/about) over a quarter (half/twice/one third) as many students as (as much money as) B.
A的学生数/钱(差不多)是B的四分之一/一半/两倍/三分之一/一样。
2) A has about (approximately/exactly/precisely) the same number (proportion/amount) of students (money) as B.
A和B的学生/钱/数量/比例差不多/正好一样。
3) A has something in common with B.
A与B有一些共同点。
4) The difference between A and B lies in _____.
A与B的不同之处在于_____。
描述趋势
1) The number increased (/rose) suddenly (dramatically/rapidly/substantially/considerably/sharply) from _____ to _____.
数量从_____激增到_____。
2) During 1990 to 2000,there was a sudden (rapid/dramatic/substantial/sharp/considerable) rise (boom) in the number of private cars from _____ to _____.
1990年到20##年间,私人汽车的数量从_____急剧增长到_____。
3) The ten years from 1990 to 20## witnessed (/saw) a steady growth of private cars from _____ to _____.
1990年到20##年10年间,私人汽车的数量从_____稳步增长到_____。
4) The number of private cars increased (rose / fell/dropped/declined/decreased) by 20%.
私人汽车数量增长了(或:降低了)20%。
5) The number of private cars in 20## was 5 times more than that in 1990.
20##年私人汽车数量是1990年的5倍。
6) The number of private cars roughly (/approximately) doubled (tripled) between 1990 and 2000.
1990年到20##年间,私人汽车数量大约是原来的2倍(3倍)。
结尾
1) We can conclude from the table that _____.
2) In short (In brief), _____.
3) In conclusion, _____.
4) To conclude, it seems clear that _____.
5) From the table/diagram, we can see _____.
6) As can be seen from the chart/table/diagram, _____.
7) It is clear (/apparent) from the chart (/graph/table) that _____.
4.5.2.5表格模板
The table shows _____.
(简要介绍表中呈现的信息。)
According to the figures,as people age in Someland, their social lives reduce.Teenagers and people in their twenties _____. People in their 30s,40s,50s and 60s _____.
(general statement,点明从数据中概括得出的一种趋势。)
Group and individual exercise follow a similar pattern.People of all ages spend a good part of their leisure time on entertainment. Teenagers and retired people _____. For everybody else, _____.
(general statement,点明从数据中概括得出的另一种趋势。)
Consequently,it can be concluded that there is a significant trend towards _____.
范文
You should spend about 20 minutes on this task.
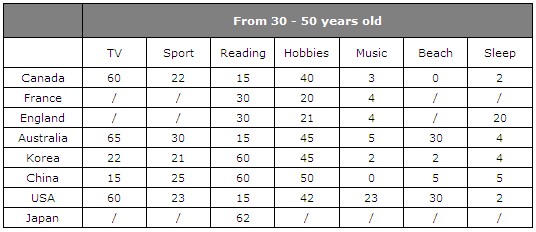
The table below give information about Favorite Pastimes in different countries.
Summarise the information by selecting and reporting the main features, and make comparisons where relevant.
Write at least 150 words.
6.jpg (39.4 KB)
20##-6-9 15:48
model answer:
This table clearly presents and compares favorable pastimes in eight different countries. The pastimes, across the top of the table, are analyzed in relation to each country.
As can be seen, about 60% of Canadians, Australians and Americans like watching television. On the other hand, this figure is quite low for China where only 15% of people watch television. Predictably, Americans like music at 23%, whereas only 2 to 5% of people in the other countries feel the same way. 20% of people in England enjoy sleeping as a pastime whereas in Canada and the USA, for example, the figure is only 2%. Interestingly, the Chinese like hobbies the most at 50%, as opposed to only 20% in France. It isn’t surprising that the highest percentage of beach-lovers is in Australia and the USA at 30%.
It seems that pastimes of people of different nationalities may be influenced by a number of factors such as the socio-economic situation or the climate. These factors influence cultural differences between different nationalities and make cross-cultural experiences more interesting.
(175 words)
You should spend about 20 minutes on this task.
Write a report for a university lecturer describing the information shown below.
You should write at least 150 words
四.饼状图
饼状图图表作文的写作要点
1介绍各扇面及总体的关系
2各个扇面之间的比较,同类扇面在不同时间,不同地点的比较
3重点突出特点最明显的扇面:最大的,最小的,互相成倍的
雅思小作文饼状图描述模板
1.描述
It is clear that the most (adj.) xx is A, which accounts for m% of all x . B is the next largest(adj.)xx ,n% lower than A of all x and followed closely by C . The above three items of xx take uo about o% of the x%
By contrast D E andF make uo the smallest percentage of total x , which are p% q% and r% ,respectively.
The regions can be divided into two groups-one where … and the other where the reverse is the case.
2.比较,占据,百分数
Form, comprise, make up, occupy
Constitute, cover, represent, account for
Be shared by
In 1950, the urban population represented less than 13% of the total. It is now about 40% and is expected to reach 60% by 2030. (摘自BBC)
3.比例,倍数
A quarter of…
Half of…
A majority of…
A has something in common with b
A shares some similarity with b
The difference between a and b lies in…
Double, triple, quadruple (v, n, adj)
原来的2倍-double, 50→100
原来的3倍-triple, 50→150
原来的4倍-quadruple, 50→200
The value of the house has increased fourfold (=it is now worth four times as much as before).
…be twice as adj. as …..
…more than xx times as adj. as …..
范文
 1.png (31.65 KB)
20##-6-11 10:43
model answer:
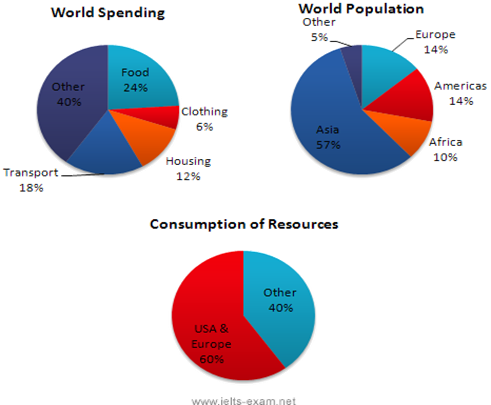
In this analysis we will examine three pie charts. The first one is headed ‘World Spending.’ The second is ‘World Population’ and the third is ‘Consumption of Resources.’
In the first chart we can see that people spend most of their income (24%) on food. In some countries this percentage would obviously be much higher. Transport and then housing are the next major expenses at 18% and 12% respectively. Only 6% of income is spent on clothing.
In the second chart entitled ‘World Population’, it is not surprising to find that 57% of people live in Asia. In fact China and India are two of the most populated countries in the world and they are both situated on this continent. Europe and the Americans account for nearly 30% of the total, whilst 10% of people live in Africa.
Finally, the third chart reveals that the USA and Europe consume a huge 60% of the world’s resource.
To sum up, the major expenditure is on food, the population figures are the highest for Asia and the major consumers are the USA and Europe.
(182 words)
-
雅思写作小作文线形图表题(附范文)
雅思写作LINEGRAPHWRITINGTASK1Test2CambridgeIELTS7Youshouldspendabout2…
-
雅思写作范文分析汇总之图表报告题
官方网站雅思写作范文分析汇总之图表报告题下面为大家汇总了雅思写作考试中图表分析写报名的相关题型供同学们进行下载参考Themapan…
-
雅思图表题作文
本文关键词雅思图表作文写作总结雅思作文Task1受图表内容的限制遣词造句的要求非常有限只需针对考试把核心表达用准用熟即可所谓博大不…
-
雅思图表题作文_A类雅思各类图表作文
A类雅思各类图表作文要点及范文一曲线图解题关键1曲线图和柱状图都是动态图解题的切入点在于描述趋势2在第二段的开头部分对整个曲线进行…
-
2天解决雅思小作文图表题
2天解决雅思小作文图表题龚超Taskone小作文requirements1Describethemainfeaturesofthe…
-
雅思小作文图表题的分析技巧
雅思小作文图表题的分析技巧柱状图:“比较”(找出similarity)和“对比”(找出difference),是写作的关键,既要横…
-
雅思写作-小作文范文-表格
雅思小作文表格题写作技巧雅思小作文中表格题是经常出现的一种也是相对比较简单的一种那么雅思小作文表格题有哪些写作技巧呢下面为大家整理…
-
雅思写作小作文线形图表题(附范文)
雅思写作LINEGRAPHWRITINGTASK1Test2CambridgeIELTS7Youshouldspendabout2…
-
雅思写作小作文图表范文
最权威的国际教育服务平台雅思写作小作文图表范文很多同学在开始看到雅思考试的小作文的时候无从下手因为在我们国家的教育中对这方面的训练…
-
雅思写作小作文图表范文
最权威的国际教育服务平台雅思写作小作文图表范文很多同学在开始看到雅思考试的小作文的时候无从下手因为在我们国家的教育中对这方面的训练…
-
20xx年雅思小作文考试题目总结
bailieducom20xx年雅思小作文考试题目总结20xx年这个百年不遇的二月就要过去了这个二月非常的神奇共28天有四个星期日…