名师:雅思图表作文6分范文实例解析
名师:雅思图表作文6分范文实例解析
在雅思考生中,普遍存在一种观点,认为小作文只占 1/3 的比重,而大作文占了 2/3 ,所以在复习的时候应该以大作文为重,考试的时候也应该先写大作文,而后再写小作文。但是在对考生实际考分的观察中我们发现,往往小作文写得好的同学,作文的总分相对较高。之前有个基础班的女生,把时间都花在了小作文上,大作文只写了个开头,但作文的总分居然拿到了 5 分。
这是什么原因呢?因为大作文在短时间内提高有限,而小作文却因套路很多,句式有限,在短时间内只要认真学习,就不难提高。所以要特别提醒广大考生,尤其是时间非常仓促的考生,千万不要忽视了小作文的学习!
以下提供的是一份 6 分的曲线图作文范文,后附考官的评语。同学们对照自己的文章,看下是否达到了 6 分的标准?
(以下内容由朗阁教育集团海外考试研究中心提供,转载请注明出处,违者必究!)
题目:
WRITING TASK 1
You should spend about 20 minutes on this task.
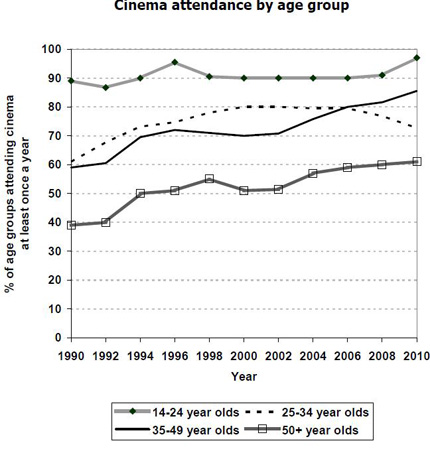
The graph below gives information about cinema attendancein Australia between 1990 and the present, with projections to 2010.
Summarise the information by selecting and reporting the main features, and make comparisons where relevant.
Write at least 150 words.
【考生样文】
The graph shows percentages of cinema attendance at least once a year in Australia between 1990 to 20## with projections for the future. The graph is described by 4 groups of different ages which are 14 to 24, 25 to 34, 35 to 49 and over 50 year olds.
The youngest age group people have been going to cinema more than any other age groups and the percentage has been keeping very high at approximately90% since 1990. It is predicted to keep the high and to increase more from 2006.
The middle age groups people have enjoyed going cinema between 60% to 80%. The percentage of age 25 to 34 group has been higher than the one of age 35 to 49 group but from 20## the percentage of 25 to 34 year olds people will decrease while the one of 35 to 49 year olds people will increase and get higher than the other one.
The oldest people seem to go cinema less than the other groups but the percentageof the attendance has slightly going up by 15% from 40% to 55% between 1990 to 20## and it will keep increasing to 60% by 2010.
Overall, it seems the younger age people, the more going to cinema.
(210 words)
【考官评语】
Band 6
This response addresses the requirements of the task and selects relevant material to describe. Key features and an overview are presented, although clearer highlighting, more support and a more comprehensive overview would be needed to reach a higher band. Information is well-organised and there is a clear overall progression in the response. There is some effective use of cohesive devices, but only limited use of reference and substitution. The range of vocabulary is not wide, but it is adequate for the task. Control of word form and spelling is consistentlygood, although there are some clumsy noun phrases that indicatelimited flexibility. The candidate attempts to use a mix of simple and complex sentences, but control is variable and grammatical errors or omissionsare quite intrusive at times. Figures are poorly integrated into sentences and indicate evident limitations.
第二篇:雅思图表作文注意事项解析
雅思图表作文注意事项解析
朗阁海外考试研究中心 康丹丹
在雅思写作过程中,考生往往会对图表作文的分析重点把握得不够准确,有的考生不知道该怎样将小作文的句型写得更流畅,还有的考生不知道怎样做才能使自己的小作文分数更高。以下是朗阁厦门雅思培训中心的专家整理的一些雅思图表作文的注意事项,希望给众多烤鸭们一些启发。
一、了解图表的要求及内容
1. 图表的要求
要注意到图表题目中的summarize, main features, comparison等词,不是所有的数据都要进行描述,不是图表中的任意趋势都要进行描述,不是图表中的任意信息都要进行对比。
2. 图表的内容
图表中提到的时间(若没有时间,就用一般现在时态)
图表中提到的单位(在文中进行数字比较时,数字后的单位不能丢下) 图表中的关键内容(峰值、低值、明显的趋势变化)
二、确定文章结构
1. 开头段一定不能照抄题目。要针对词汇和句型做一部分修改。
2. 段与段之间要有有效的连接成分。
3. 要有鲜明的重点对比,不要面面俱到,变为流水账。
三、语言表达
1. 图表词汇一定不要出现单词拼写错误。
2. 图表词汇的搭配使用一定要准确无误。
3. 图表描述使用的时态和语态一定要准确。
4. 图表描述使用的句型一定不要出现错误。
5. 多样化的句子结构(简单句、复合句、状语成分)。
6. 句子之间的表达要连贯。
7. 句子之间的逻辑关系要合理(并列、转折、递进)。
8. 不要发表任何主观的意见。
四、各种图表的特点
Pie Chart
1. 明确占量多少
2. Pie和pie之间的比较
3. Pie与总量的比较
Line Graph
1. 一定有趋势
2. 按照趋势变化进行描述
3. 趋势融合数据
4. 起点、中点、重点、终点
Bar Chart
1. 柱与柱之间数值差异性
2. 数据较多,只抓重点数据(高、低、差额大、差额小)
3. 有趋势,趋势融合数据
Table
1. 数据较多,选择重点(高、低值)
2. 注意考题要求的比较对象,来进行横比或纵比
3. 将表格事物进行分类并找出异同点
Flow Chart/Map
1. 注意图表描述顺序(自上而下,自左向右)
2. 图表中的细节无一错过
3. 明确图中信息,不能臆造
4. 注意使用被动语态
5. 注意Map中方位词的使用
五、关键词汇和句型
1. 变化状态幅度词(要依据描述的情况决定)
轻微-----slightly, slowly(速度), steadily(平缓)
逐渐-----gradually
显著-----significantly, markedly
急剧-----rapidly, dramatically, abruptly,sharply
突然-----suddenly
2. 变量幅度词语
增加-----increase, jump ,go up ,rise, climb , ascend , level up ,surge 减少-----decrease, drop ,go down ,fall,descend, level down
最高-----reach a highest point/the top/the summit/the peak, the most, peak in
最低-----reach a lowest point/the bottom/, hit a trough, bottom out 交叉-----correspond with in XXX year, crossing the line for
水平-----keep/stay/remain/maintain stable,steady,be similar to,there is little/hardly any/no change
3.关键句型:
1. The biggest difference between 2 groups (A+B) is in …,where A makes up 5% while B constitutes 67%, the highest percentage of A, which was approximately 12%.
2. The percentage of A in …。.is more than twice that of B, the ratio is 67% to 45%.
3. In…,while a greater percentage of A than B are found in…(the former is …and the latter is …)
4. There are more A in……,reaching …,compared with …of B.
5. A, which used to be the……。.,has become less important, which declined(increased) sharply from … in 1978 to only … in 1998.
6. There was变化趋势in the number of A from 1986-1990(over next…。.yeas),which was followed by变化趋势and then变化趋势until 1998 when there was变化趋势for the next ….years.
7. From 1990 onwards, there was变化趋势in the number of A which then变化趋势 at… in 1994.
8. In 1990,the number reached (was) …,but 30 years later there was变化趋势。
9. After变化趋势from…to …,A begin变化趋势over the next….years.
10. The number of …increased rapidly from 1988 to 1990 during the five-year period.
11. A has almost/nearly/about/over a quarter/half/twice/one third/as many studentsas/as much money as /B; A has about/approximately/exactly/precisely the same number/proportion/amount of students/money as…。.
12. It has reached something of a plateau,X percent/an average of X percent in the past few years in 1998.
13. In the 3 years spanning from 1995 through 1998.。.the percentage of.。.is slightly larger/smaller than that of.。.the graphs show a threefold increase in the number of.。.decreased year by year while.。.increased steadily.。.here is an upward trend in the number of…(year)witnessed/saw a sharp rise in.。.
14. A has something in common with B/ the difference between A and B lies in…
六、比较结构
1. Low income consumed more hamburgers than other group (=more than other group on hamburgers), spending more than twice/ as much as hamburgers than FC and Pizza(both about 40%)。
2. High income favored pizza, spending 。., followed by FC at …, then…。
3. High income appears to less than other group on hamburgers, pizza remains their most popular fast-food, followed by FC.
4. In 1975, among 3 of the world’s largest cities, San Paulo had the highest population (about 0.5 billion), and ……is the second highest(about …。.)……had the lowest population (about …。).
As a result in 1990, the number of ….appears the largest population, closely followed by …, then…….at……
5. The table below shows the figures for imprisonment in 3 countries between 1930-1960 in Great Britain, the numbers in prison has increased from…in 1930 to …in 1940, apart from in 1950 when the numbers in prison fell by…
6. On the other hand, New Zealand and Australia are the only two countries in which the numbers in prison remain steady from 1930-1960, although there have been slightly fluctuations in this trend.
7. In the period 1975to 1990,all cities showed a growth, Tokyo and New York had by far the largest increase (about…。.).San Paulo had the smallest growth (about…)
8. There were no figures given for male part-time workers. In unemployed group, men enjoyed more leisure time---over 80%,compared with 40% for women, markedly more than women in retired group.
-
雅思图表作文_A类雅思各类图表作文要点详解及范文
A类雅思各类图表作文要点详解及范文一曲线图解题关键1曲线图和柱状图都是动态图解题的切入点在于描述趋势2在第二段的开头部分对整个曲线…
-
雅思图表线性图写作范文
WRITINGTASK1Youshouldspendabout20minutesonthistaskThegraphbelowgivesinforma…
-
雅思写作-小作文范文-柱状图
柱状图C1T3题目Thechartbelowshowstheamountofmoneyperweekspentonfastfood…
-
雅思图表作文模板句
雅思图表作文模板句Para1Thisisatablechartline线状bar柱状pie饼状graphwhichdemonstr…
-
雅思写作小作文图表范文
最权威的国际教育服务平台雅思写作小作文图表范文很多同学在开始看到雅思考试的小作文的时候无从下手因为在我们国家的教育中对这方面的训练…
-
雅思小作文图表题的分析技巧
雅思小作文图表题的分析技巧柱状图:“比较”(找出similarity)和“对比”(找出difference),是写作的关键,既要横…
-
雅思写作-小作文范文-表格
雅思小作文表格题写作技巧雅思小作文中表格题是经常出现的一种也是相对比较简单的一种那么雅思小作文表格题有哪些写作技巧呢下面为大家整理…
-
雅思写作小作文线形图表题(附范文)
雅思写作LINEGRAPHWRITINGTASK1Test2CambridgeIELTS7Youshouldspendabout2…
-
雅思写作小作文图表范文
最权威的国际教育服务平台雅思写作小作文图表范文很多同学在开始看到雅思考试的小作文的时候无从下手因为在我们国家的教育中对这方面的训练…
-
雅思写作小作文图表范文
最权威的国际教育服务平台雅思写作小作文图表范文很多同学在开始看到雅思考试的小作文的时候无从下手因为在我们国家的教育中对这方面的训练…
-
雅思经典图表作文范文zlj
43Youshouldspendabout20minutesonthistaskThetablebelowshowsCO2emissionsfordi…