图表作文范文汇总
图表作文范文汇总
假如你是Li Hua,是一名国际学校的学生。你最近对200名同学(男女各半)的择业理想做了一次调查,并根据调查结果(如图所示)谈谈你的看法。
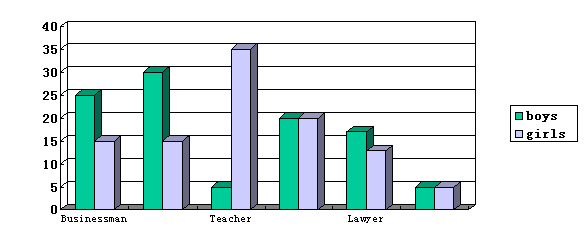
I have recently made a survey among 200 boys and girls about their future jobs.
As can be seen from the chart,what boys like to do most is to become scientists and their second choice is to become businessmen. Whilethe largest group of girls would like to be teachers. Only a few boys want to do this job.
It is interesting that the numbers of boys and girls who want to be doctors are equal. As for lawyer, more boys expect to have this job. However, there are still some students who are not clear about their future.
As for me , I would like to be a …because …
07崇文一模
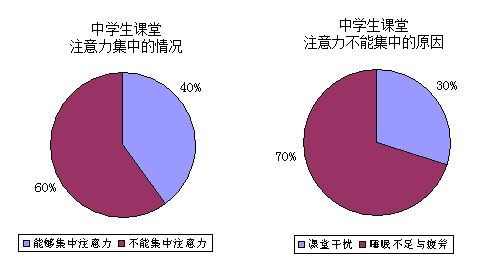
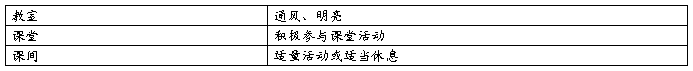
某英文报纸正在开展题为“中学生课堂注意力”的专栏讨论,你校准备参加,并请你代表学校写一篇文章给该英文报纸投稿。下面的图表为你校的调查结果,请你根据所提供的信息做简要说明,并根据提示给出改善的建议。注意:图中数据为学生人数百分比。

改善注意力的建议:
注意:1.词数:不少于60。
2.可根据内容要点适当增加细节,以使行文连贯。
一、内容要点:
1. 40%的学生能够集中注意力;60%的学生不能集中注意力
2. 不能集中注意力的学生中,30%的学生受课堂干扰;70%的学生是由于睡眠不足与疲劳
3. 改善注意力的建议
二、说明:
1. 内容要点可用不同方式表达。
2. 对紧扣主题的适当发挥不予扣分。
三、One possible version:
A survey has been made about how long middle school students can fix their attention in class during each period. The result shows that only 40% of the students can draw their attention to the class, while the rest of them can not concentrate on the lesson. 30% of the students think the problem is caused by all kinds of noises in the classroom; the other part of the students consider the lack of sleep and tiredness as the major causes.
Therefore, we advise that the classroom be bright and the air inside stay fresh. As for students, they should try their best to be active in class in order not to be disturbed by others. During the breaks, they can take some exercises outdoors or have a little rest in the classroom.
20##年北京卷
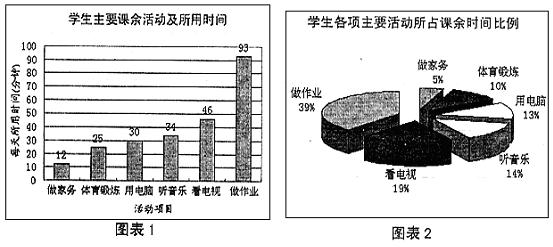
某学校对中学生课余活动进行了调查,结果如下。请根据图表1提供的信息描述学生每天的课余活动,并针对图表2中任何一个数据中反映的情况写出你的一个看法。词数不少于60。
生词:图表chart
一、内容要点:
1. 图表1中六项活动及所用时间
2. 图表2中一个数据反映的情况
3. 自己的一个看法
二、说明:
1. 内容要点可用不同方式表达。
2. 对紧扣主题的适当发挥不予扣分。
三、One possible version:
Chart 1 shows the daily average amount of time the students of the school spend on different after-class activities. The students put the most time-93 minutes-into their homework, and next in line is watching TV, which takes up 46 minutes. They put in about the same amount of time listening to music and working on the computer, 34 minutes and 30 minutes each. While 25 minutes is spent on sports, only 12 minutes goes into housework.
As is shown on Chart 2, only 10% of the time is taken up with sports activities. I think the school should encourage the students to do more exercise after class. This way, they may be healthier and more energetic.
高二下学期期中考试试题
One possible version:
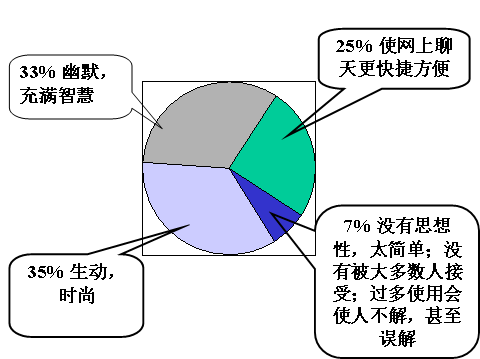
At present, Internet slang, such as “GG”, “MM”, “Xia Mi”, has become popular among the teenagers. According to a survey conducted by our Students’ Union, students’ opinions on this issue are divided.
Most of the students are in favor of the Internet slang. About 35% of the students hold the view that Internet slang is vivid and fashionable. Another 33% of the students enjoy its humor and intelligence. And a quarter of the students believe it makes chatting on the Internet convenient.
However, there are 7% of the students thinking Internet slang lacks depth of thought and is too casual. In addition, it is hard for most people to understand and accept this kind of slang. If it is used too much in a passage, it may make readers confused, and even cause misunderstanding.
In my opinion, living in the Information Age, if we are not familiar with Internet slang, we are likely to fall behind.
08年海淀一模写作
目前,家长开车接送孩子上下学已成为一个普遍现象,人们对此做法褒贬不一。下面是就此现象所做的问卷调查结果。
请根据下列图表提示,描述被访者的看法。
注意:1、词数不少于60。
2、文章的开头已经给出。
3、可以适当增加细节,以使行文连贯。
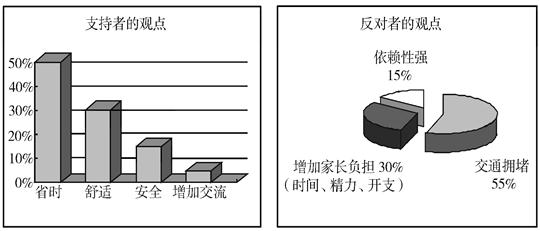
Nowadays it’s a common phenomenon that parents drive their children to school in and back home, which causes a heated discussion. A survey has just been conducted about it, and the findings are as follows.
One possible version:
We can see that half of the supporters believe that more valuable time can be saved for students to get enough sleep. Another 30% think children can rest or have meals comfortably in their own cars. About 15% consider it reasonable just for the sake of children’s safety. The rest of them think it offers more chances for parents to communicate with their children.
However, there are still many people who hold different opinions. 55% of them believe that it results in more traffic jams, especially around schools in rush hours. And 30% think that driving kids to and from school will undoubtedly add to the parents’ burdens in aspects like time, energy and expenses. Still, 15% worry that in the long term children may be more dependent on their parents, which does no good to them.
20##海淀高三上期末
北京市政府发出限行通告规定私家车每周限制行驶一天。下面是某网站就此事进行的问卷调查结果。请根据下列图表提示,描述被调查者的不同看法,并简单谈谈你自己的观点。
注意: 1、文章的开头已为你写好。
2、词数不少于60。
Beijing government has announced a car restriction that private cars shall take turns off the roads one out of five workdays.
______________________________________________________________________________________________________________________________________________________________One possible version:
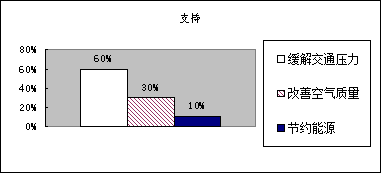
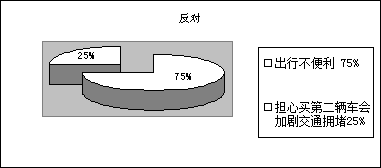
Beijing government has announced a car restriction that private cars shall take turns off roads one out of five workdays.A survey has been conducted about this issue on the Internet and the findings are as follows.
Many people support the restriction. 60% of them believe that it relieves the present traffic pressure. And 30% think it helps improve the air quality. The rest of them, about 10% , consider it saves energy.
However, there are still many people who are against the new rule. About 75% among them think it inconvenient that they can’t drive their own cars on a certain workday. 25% are worried that more people will buy their second cars, which may cause heavier traffic.
In my opinion, the new traffic rule is really an effective measure to reduce traffic jams and air pollution.
20##年海淀一模
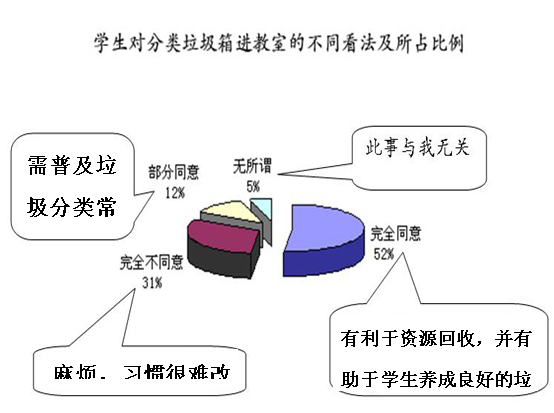
最近,你校学生会对分类垃圾箱是否进教室一事进行了调查,调查结果见下表。请根据图表提供的信息用英语写一篇短文,介绍同学们的不同意见和看法,并表达你自己的观点。注意:词数不少于60。 提示词:饼状图 pie chart
内容要点:
1.进行调查 conduct a survey
2.肯定看法 support the program
3.否定看法 oppose the program
4.个人观点 personal idea
One possible version:
Recently the student union conducted a survey on whether recycling dustbins should be set in classrooms.
As can be seen from the pie chart, different students hold different opinions on this program. Only a few students care little about it. Surprisingly, about one third of students are totally against the program. They don’t bother to change their old habits. However, over half the students are completely for the program, as it is not only beneficial to recycling of resources, but also it can help students develop their good habits of garbage classification. Besides, 12% of the students partly agree. They hold the opinion that educating people on how to classify the garbage goes first.
Personally, I’m in favor of this program. I believe it’s important to raise people’s awareness of garbage classification, from which we will get considerable benefits for the future.
第二篇:考研英语二图表作文范文及核心词汇
考研英语二图表作文预测:全国出境游
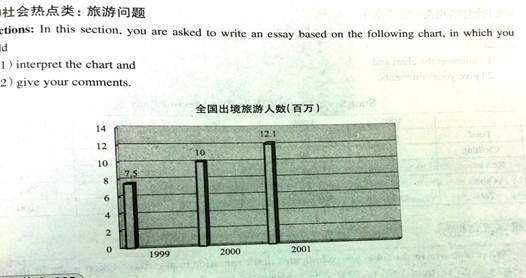
Topic 3: The boom of overseas traveling industry
From the bar chart given above, we can observe that the number of people traveling abroad experienced some changes during the past several years. From 1999 to 2000, the number of Chinese people traveling abroad increased rapidly from 7.5 million to 10 million, and then to 12.1 million in 2001.
The bar chart reveals that people in mounting numbers are going to travel abroad. What exactly contribute to this phenomenon? Reasons can be listed as follows: for one thing, the authorities have issued some preferential policies to promote the development of the overseas tourism industry, which encourages a sudden emergence of travel agencies that can provide customers with convenient overseas tourism services. Additionally, with the improvement of financial status and purchasing power, a considerable number of Chinese people can afford the once-deemed-expensive traveling expenses. Last but not least, as there exists huge difference in cultures, customs and landscapes between China and overseas countries, quite a few people hold that overseas traveling is not only a perfect way to relax oneself, but also enrich their knowledge and expand their horizons.
By observing the past trends, we may forecast that the growth tendency will continue. However,it is also a highly variable industry which is vulnerable to seasons and climates, international political situation,fluctuations in exchange.
考研英语二图表作文预测:电子商务成交额
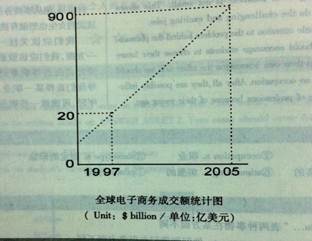
Global E-commerce turnover
From the curve chart given above, we can observe that the turnover of global E-commerce experienced some change during the past several years. From 1997 to 2005, it rose dramatically from 20 billion to 900 billion.
The curve chart reveals that the global E-commerce industry enjoys an explosive growth. Quite a few reasons can be listed to account for this phenomenon, and the followings might be the most critical ones: for one thing, the authorities of different countries have issued some preferential policies to protect and encourage the development of E-commerce, thus quite a few online-transaction websites emerge overnight. Moreover, the one-click-payment consumption mode has been widely accepted by the public thanks to the widespread availability of the Internet. Last but not least, people’s decision to purchase on-line can also be put down to the power of so-called “group-dynamics”: when our friends are shopping at network, we will be influenced by them and imitate their behaviors unconsciously.
The rapid development of E-commerce signals that new business models contribute largely to the sustainable development of the global economy. However, when enjoying the fruits offered by modern technology, we should also keep an eye on the underlying threat of it. In a world features open boundary, deception and fraud sometime abound. (209 words )
考研英语二图表作文预测:职业选择
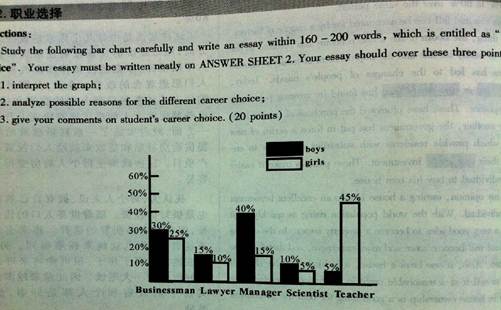
Different job inclination between boys and girls
From the bar chart given above, we can find that it reflects the statistics of profession inclination between girls and boys. Most obviously, 40% of boys intend to be a manager, with only 15% of girls choosing this job. When it comes to the profession of teacher, we can observe that 45% of girls prefer to take this job, while the proportion of boys only account for 5%, 40% lower than that of girls.
The bar chart informs us of the phenomenon that there exists some difference in profession inclination between boys and girls. What exactly contribute to this phenomenon ? reasons can be listed as follow: for one thing, quite a few boys regard being a manager as a symbol of success. As this profession stands for promising futures, fat pay and competence. Moreover, boys’ decision to be a manager can also be attributed to the power of so-called “group dynamics”: when members of their social network prefer to be a manager after graduation, they are easily influenced and imitate others’ behavior unconsciously or consciously. When it comes to girls, the are more inclined to be a teacher. As this profession features stability and respect. Take social and biological factors into account, we know that it is reasonable for girl to choose teacher as their ideal profession goals.
Both girls and boys have rights to choose their profession. However, one thing we should bear in mind is that there exists no better or worse, superior or inferior jobs, but suitable and satisfactory ones. (254words)
考研英语二作文范文:中国职业的变化
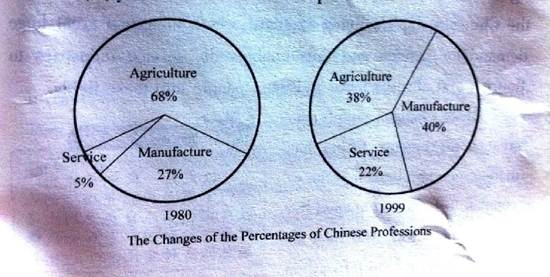
The changes of Chinese professions
From the pie chart given above, we can observe that the professions structure of Chinese people experienced some changes during the past several years. From 1980 to 1999, the percentage of agricultural professions decreased by 30% from 68% to 38%. During the same period, however, service sectors increased rapidly from 5% to 22%. When it comes to the manufacturing professions, its percentage rose markedly from 27% in 1980 to 40% in 1999.
The pie chart reveals the phenomenon that there exists some difference in the development tendency among different professions in China. What exactly contribute to this phenomenon ? reasons can be listed as follows: for one thing, with the rapid process of urbanization, people in mounting numbers, especially youngster, have left their village homes ,moved into big cities and thus been out of agricultural industries. Moreover, quite a few people, especially college graduates hold that it is comparatively easy for them to make more money in the service industry. When it comes to the manufacturing industry, its transformation might be attributed to the adjustment of industrial structure: the authorities have issued some preferential policies to promote the rapid extension of manufacturing industry, thus, more workforces are required.
By observing the change over the past several years, we may forecast that the proportion of professions of service and manufacture will continue to rise. However, a high value should be placed on the development of agricultural industry by the public and the authorities. Otherwise, with the number of people who are engaged in agriculture diminishing, we will one day have nothing to eat! (262words)
考研英语二作文范文:快餐和坐下来餐厅发展趋势

The development tendency of fast food and sit down restaurant
From the curve chart given above, we can observe that the number meals of fast food and sitdown restaurant experienced some changes during the past several years. The number of meals of fast food increased slowly from 20 in 1970 to nearly 30 in 1980. From 1980 to 2000, it ascended rapidly from 30 to approximately 90. On the contrary, when observing the statistics of sitdown restaurant meals, we can find that it increased slowly from 20 in 1970 to roughly 50 in 2000.
The curve chart informs us of the phenomenon that there exists some difference in the development tendency between fast food and sitdown restaurants. What exactly contribute to this phenomenon? Reasons can be listed as follows: for one thing, with the pace of modern life quickening, people barely have much time to waste in lining up for restaurant meals, on the contrary, fast food meals can do help busy people save a great deal of time. Additionally, the authorities have issued some preferential policies to protect and encourage the rapid extension of fast food industry , thus the public can buy fast food at shops scattering around the city. On the contrary , people in diminishing numbers are willing to eat at sitdown restaurant. They think that eating at restaurant is always time-consuming and inconvenient. Besides, food at restaurant is comparatively expensive than fast food.
by observing the trend of the past, we may forecast that the number of fast food meals will continue to rise in the years to come. However, we should also take the detrimental impact of fast food into consideration. Do remember that fast food is one of the main causing factors of diseases such as heart attack, obesity and diabetes.
英语二
BY @曾小哲同学
整理来自跨考网
-
图表作文经典用词总结
图表作文经典用词总结。审题、读图、概述、原因分析、预测未来Introduction—Body--Conclusion描述图表内容:…
-
英语学习_英语图表作文_必备
弃我去者,昨日之日不可留乱我心者,今日之日多烦忧简介图表作文是考研英语写作中较为常见的题型之一,也是难度较大的一种写作题型。这类作…
-
Egcfmqy英语图表作文
生命是永恒不断的创造,因为在它内部蕴含着过剩的精力,它不断流溢,越出时间和空间的界限,它不停地追求,以形形色色的自我表现的形式表现…
-
帮助大家更好准备英语四六级图表作文
帮助大家更好准备英语四六级图表作文,现给大家提供“英语六级考试图表作文的常用词”总结,希望对你们考试有帮助!1.有用的词上升:in…
-
雅思写作基础教材——图表作文部分小结
雅思写作基础教材——图表作文部分小结Piechart1、对题目的改写部分asapercentageof整体Thepiechartg…
-
20xx高职高专写作大赛图表作文讲解及参考范文
英语四级图表作文讲解及参考范文图表作文也是四六级考试中常见而且被认为是一种较难的作文形式图表作文就是把非文字信息通常为各种图表表示…
-
中考英语作文范文-图表说明文
中考英语作文英语作文模板图表作文的框架asisshownindicatedillustratedbythefigurepercen…
-
雅思写作小作文线形图表题(附范文)
雅思写作LINEGRAPHWRITINGTASK1Test2CambridgeIELTS7Youshouldspendabout2…
-
雅思写作小作文图表范文
最权威的国际教育服务平台雅思写作小作文图表范文很多同学在开始看到雅思考试的小作文的时候无从下手因为在我们国家的教育中对这方面的训练…
-
考研英语写作大作文范文及模板:图表作文
20xx12211151作者来源互联网字号TT摘要考研英语写作大作文范文及模板图表作文图表作文1写作攻略图表作文是考研英语写作中较…
-
英语图表写作
图表写作一以表格形式,将统计的数据或被说明的事物直接用表格形式体现出来,即统计表。(表格table)二是以图形形式(几何图形fig…