四六级图表作文
Directions: For this part, you are allowed 30 minutes to write a composition on the topic How People Spend Their Holidays. You should write at least 120 words, and base your composition on the table and the outline given below:
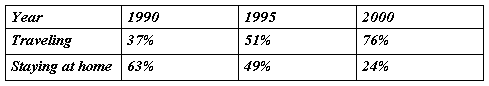
1.根据上表,简要描述1990年,1995年,20##年某城市人们度假方式的情况及其变化。
2.请说明说这些变化的原因。
3.得出结论。
How People Spend Their Holidays
As is clearly shown in the table that there was a dramatic change in the way people spent their holidays between 1990 and 2000. Especially, in 1990, 63% of people spent their holidays at home, while the figure decreased considerably to 24% in 2000. There are three reasons for this phenomenon.
To begin with, with the development of the market-oriented economy, people earn by far more money than they used to, making it possible for them to afford traveling expenses. In addition, people realize the importance of getting well-informed about the outside world in this modern era to develop their potential. For example, a traveler may encounter or talk with someone of a different cultural background so as to broaden his vision. Last but not least, by traveling outside, people are close to nature, which is not only beneficial to both their health and peace of mind. In short, more and more people take the occasion of holiday to travel outside and relax themselves.
As far as I am concerned, I prefer to go traveling instead of staying at home during holidays. On the one hand, I love meeting different people and take in some fresh ideas. On the other hand, it is agreed that the world is becoming a global village. No one could confine himself within his small circle of families and relatives. In brief, I have benefited a lot and will benefit more from traveling during the holidays.
四六级---图表型作文
图表作文至少包含描述图表与解释原因两个部分,而当前的图表作文大多还有第三个段落。图表作文的规律性很强,不像图画式作文那样富于变化。
1.首段的写作
图表作文有表格(table)、柱形图(bar chart)、饼状图(pie chart)和折线图(diagram)之分,后三种都是属于图表的范畴(chart)。不管是chart还是table,都需要进行描述,一般放在文章的第一部分,长度宜适中。描述数据我们要首先看看是几个变量(A),每个变量有几个数据(B),不妨以A*B表示。
如果只有一个变量,有三个数据,可以描述如下:
From the chart we can see clearly that the average number of hours a student spends on Internet per week has increased from less than two hours in 1998 to nearly four hours in 2000, and then to 20 hours in 2004.
如果是最常见的是2*3的情形,可以描述如下:
From the chart, we can see clearly that in a big city in China, state owned houses declined from 75% in 1990 to 60% in 1995 and then to 20% in 2000, while private houses rose from 25% to 40% and then to 80% during the same period.
这里用了while引起从句来突显对比,是一种非常好的办法,如果用两句话来描述,也完全可以。
如果是1*n(n>3)的情形,将头与尾描述出来即可,比较好的方法就是在句中描述最后一个与第一个相比变化了多少。
碰到多变量、每个变量多数据的情形,大家应首先进行分类,分成上升、下降两类,或者上升、下降、不变三类,这样问题就迎刃而解了。
2. 第二段的写作
第二段是解释原因的段落。我们谈谈两个问题。
首先是过渡句这个问题。这里不大可能放在第一段,因为第一段不可能象有的命题作文那样简洁(如只有一句)--例如提纲式作文中的批驳类文章中除二段首句批驳之外还有首段末句批驳,效果很强烈。
其次就是此段的主题句(topic sentence)的问题。此句或主观或客观并无拘束,只要上下文风格统一即可。
主观:We believe that three reasons can account for this phenomenon.
I believe that three reasons can account for this phenomenon.
In my mind, the reasons why the overseas students are on the rise are as follows.
主观之变体(使用插入语,突显主语):Three reasons, we believe, can account for this phenomenon.
Three reasons, I believe, can account for this phenomenon.
Three reasons, I firmly believe, can account for this phenomenon.
注意:插入语的使用属于看似平淡却极富功力的技巧,可以达到很好的效果。
主观之变体(使用插入语):Three reasons, in my mind, can account for this phenomenon.
客观:Several reasons can account for this phenomenon.
在主题句之后,可以使用连接词分两个、三个或四个方面来写,其中分三个方面来写最为常见。这里就与普通的说明文与议论文一样了--可以由最重要的到最不重要的,也可以由最不重要的到最重要的,也可能平行分布,依具体情况而定,不一而足。
3. 第三段的写作
第三段直接写结论的情况已基本没有了。如果这篇文章讲的是一个令人担忧的问题,那么这一段写解决办法的可能性最大。
如果这篇文章讲的是一个好的变化,那么这一段很可能是两种情况--可能写负面的影响或存在的问题,或者写未来趋势或发展方向。
咱们看看很象利弊类的情况,如一篇文章的第三段:
上述情况均是依提纲而定,提纲中如果没有第三点,那么一般说来,若是问题则写办法,若是好事则写展望,根据具体情况而定。
^^^^^^^^^^^^^^^^^^^^^^^^^^^^^^^^^^^^^^^^^^^^^^^^^^^^^^^^^^^^^^^^^^^^^^^^^^^^^^^^^
图表作文可综合提供题目、数据、图像、提纲,形式多样,但实际上只涉及5个方面:描述图表、指明寓意、分析原因、联系实际、给出建议。从写作类型来看,基本上属于说明文。要求考生围绕题目将有关信息转化为文字形式,考生应该具有一定数据分析和材料归纳的能力,同时会运用一定的写作方法。一般以三段式写作方法来组织文章,第一段总结归纳信息反映的整体情况,点出主题思想,第二段回答第一段所得出的问题,对数字、数据等做出有条理的分析比较,第三段做出总结或给以简单的评论。
—— 表格可以表示多种事物的相互关系,所以考生要对表格中所给出的大量数字进行比较分析,从中找出其变化规律。
—— 曲线图常表示事物的变化趋势,考生应认真观察坐标系所显示的数据信息,并且密切注意交汇在坐标横轴和纵轴上的数字及单位。
—— 柱形图用来表示各种事物的变化情况及相互关系,要求考生通过宽度相等的柱形的高度或长度差别来判断事物的动态发展趋势,因此考生应密切关注坐标线上的刻度单位及图表旁边的提示说明与文字。
—— 饼形图表示各事物在总体中所占的比例及相互关系,旨在要求考生准确理解并阐述一个被分割成大小不等切片的饼形图所传达的信息。考生应清楚掌握部分与整体,部分与部分之间的相互关系,这种关系通常是以百分比的数字形式给出的。
2.必背模版句型
As can be seen from/in the chart/diagram/table/graph...
从表格/图形中我们可以看到……
The table shows a three times increase over that of last year.
表格显示比去年上升了3倍。
According to /As is shown in the Table /Figure/Chart...
如表格/图表中显示……
The number is 5 times as much as that of...
此数字是……的5倍。
It has increased by three times as compared with that of ...
同……相比,增长了3倍。
It can be seen from the chart/diagram/table/graph/figures/statistics that...
从表格/图表/数据中我们可以看到……
From the table/figures/data/results/information above, it can/may be seen/concluded/shown/estimated/calculated/inferred that...
从以上的表格/图表/数据/结果/信息中,我们可以看到/总结/预测/计算/得出……
A has the highest sales figure in the three departments, followed by B and C.
在3个部门中,A的销售额最高,其次是B和C。
The figure of A is about twice as much as that of B.
A的数字是B的两倍。
The rise lasted for two weeks and then began to level off in August.
上升两个星期后,8月份开始平稳。
It accounts for 30% of the total population.
占到总人口的30%。
The number of students has reached 500, indicating a rise of 20%, compared to last semester.
学生人数达到500人,与上个学期相比上升了20%。
It picked up speed at the end of this month.
这个月底加快了速度。
The pie charts show the changes on... in some place in 2000.
此饼形图显示了20##年一些地方……的变化。
from this year on,there was a gradual declined reduction in the..., reaching a figure of...
从这年起,……逐渐下降至……
There are a lot of similarities/differences between...and...
……与……之间有许多相似(不同)之处
It can be drawn from the chart that the proportions of A and B are going down, though the falling level of the latter is a lot lower/higher than that of the former.
尽管B的下降速度比A要慢/快,从表中我们可以看到A和B的比例都在下降。
The increase/decrease is more noticeable during the second half of the 5 year period.
在5年期限的后半段,增长/降低比较明显。
It falls from 50% in 20## to 30% in 2004, and then the trend reverse, finishing at 58% in 2005.
从20##年的50%降到20##年的30%,然后形势逆转,20##年达到了58%。
The table shows the changes in the number of...over the period from...to...
该表格描述了在……年之……年间……数量的变化。
As can be seen from the graph, the two curves show the fluctuation of...
如图所示,两条曲线描述了……的波动情况。
^^^^^^^^^^^^^^^^^^^^^^^^^^^^^^^^^^^^^^^^^^^^^^^^^^^^^^^^^^^^^^^^^^^^^^^^^^^^^^^^^^
常用句型
一.表示说明的句子:
1.As we can see from the chart / graph /table/diagram,……从图表中我们可以看出……
2. The chart/table/diagram shows/displays that……如图所示
3.As (can be ) shown in /According to the chart / graph/table/diagram ……如图所示……
4.The figures /statistics in the chart reflect/stow/reveal (that) ……图中的数据表明……
5.The chart /graph/table /diagram illustrates /describes……图中描述了……
6.It’s clear from the chart that……从图表中我们可以清楚地看到……
二.表示数据的常用格
1.……had the largest percentage/proportion of ……在……方面具有很大的百分比。
2.……account(s) for /take(s) up 10%.……占有10%。
3.……Compared with A,B has a higher percentage.与A相比,B有更高的比例。
4.On the top of the list is ……,which accounts for 60%.占比重高的是……,占……60%。
5. At the bottom is ……,which takes up 20%.占最低比重的是……,占20%。
6.A is second to B.A仅次于B。
7.A is ranked/rated first, followed by B at 30% and C at 25%.A占的比重最高,紧随其后的是占30%的B和占25%的C。
表示数据变化的常用句式
a.表示增加、减少和波动的常用结构
1.The number of (private cars)increaseed/rose suddenly/rapidly/dramatically/substantially/considerably/sharply/rapidly from ……to……从……到……期间(私家车)的数量有了急剧的增长。
2.There was a sudden /rapid/dramatic/substantial/considerable/sharp/steep increase/rise in the number of (private cars)from……to……从……到……期间,私家车的数量有了急剧的增长。
3.There was a boom in the number of (private cars)from……to……从……到……期间(私家车)的数量有了急剧的增长.
4.The number of (private cars)climbed /jumped/rose suddenly/went sharply up/soared to……in……在……(时间),(私家车)的数量猛增到……辆。
5.There was an evident/apparent/obvious increase in……from……to …… 从……到……期间,在……方面有明显的增长。
6.The number of (private cars)increased/rose steadily/gradually from……to……从……到……期间,(私家车)的数量有了稳定持续的增长。
7.There was a steady /gradual increase/rise in the number of(private cars)from ……to……从……到……期间,(私家车)的数量有了稳定持续的增长。
8.There was a slight/slow increase/rise in the number of(private cars)from ……to……从……到……期间(私家车)的数量有了稍微/缓慢的增长。
9.The number of(private cars)increased/rose slightly/slowly from ……to……从……到……期间,私家车的数量有了稍微/缓慢的增长。
10.The number of (private cars)decreased/fell/dropped suddenly/rapidly/dramatically/substantially/sharply/steeply from……to……从……到……期间(私家车)的数量有了急剧的下降。
11.There was a sudden/rapid/dramatic/substantial/sharp/steep decrease/drop/reduction/decline in the number of(private cars)from ……to……从……到……期间(私家车)的数量有了急剧的下降。
12.There was a(n) evident/apparent/obvious reduction/decline in ……from……to……从……到……期间,在……方面有了急剧的下降。
13.The number of (private cars)dropped sharply/went sharply down to……in……在……(时间),(私家车)的数量急剧下降到……(辆)。
14.The number of(private cars) fell/droppped/declined by……% from……to……在……(时间),(私家车)的数量下降了百分之……
15.The number of(private cars)increased/fose by……% from ……to……在……(时间),(私家车)的数量增加了百分之……
16.There was a slight fluctuation in the number of(private cars)from……to……从……到……期间,(私家车)的数量有轻微的波动。
b.表示变化不大或没有变化的常用结构
1.The number of (private cars )remained steady/stable/constant between……and……从……到……期间,(私家车)的数量保持稳定!
1. 描述图表总趋势的常用句型
1) The line/bar/chart/table shows /reveals/reflects/illustrate/displays that …
2) As can be seen from the line/bar/chart/table that …
3) It can be seen /concluded from the line/bar/chart/table that …
2.用于二者比较/对比的常用句型
1) A is twice /three times as much as B
2) A is thirty percent higher than B
3) The number of A is five times as much as that of B
4) The number /figure /percentage has doubled /tripled /quadrupled , compared with ….
5) A increased from …., while /whereas B….
3.表示“上升下降 增加减少”的常用句型
1) A increased/rose/grew from….
2) There is an increased / a rise /an upward trend of A/that….
3) There is a decreased / a reduction / decline / a drop / a downward trend of A / that ….
4.表示“最高点”的常用句型
1) A reached a peak of ….
2) A increased steadily , reaching a peak of ….
5.表示“最低点”的常用句型
1) The percentage /figure of A reached the bottom of ….
2) The percentage /figure of A reached the bottom of …., B reached the bottom of ….
6.表示“波动”的常用句型
1) There is a minor fluctuation during The percentage /figure of A reached the bottom of ….
-
帮助大家更好准备英语四六级图表作文
帮助大家更好准备英语四六级图表作文,现给大家提供“英语六级考试图表作文的常用词”总结,希望对你们考试有帮助!1.有用的词上升:in…
-
英语四六级图表图画作文模板
四六级图表图画作文写作思路模板与范文图画作文写作思路是固定的描述图片阐明观点给出建议第一段重点描述图画内容对图画内容的描述可以用图…
-
英语四六级图表作文万能模板
20xx年12月英语四六级图表作文万能模板这类作文时注意以下几点审题时除了要把握好图表的表层信息外还要分析图标的深层含义如原因根源…
-
四六级图表作文万能模板
20xx年12月英语四六级图表作文万能模板这类作文时注意以下几点审题时除了要把握好图表的表层信息外还要分析图标的深层含义如原因根源…
-
四六级图表图画作文模板
以下为四六级图表图画作文模板供大家参考希望对大家有帮助哦沪江英语第一时间更新动态敬请关注图片模板Itseemstomethatth…
-
帮助大家更好准备英语四六级图表作文
帮助大家更好准备英语四六级图表作文,现给大家提供“英语六级考试图表作文的常用词”总结,希望对你们考试有帮助!1.有用的词上升:in…
-
大学英语四六级作文总结
大学英语四六级作文一四六级作文试题分类四六级作文从试题角度可以分为现象解释型对比选择型问题解决型观点论证型与应用文五种类型一现象解…
-
大学英语四六级考试写作图表作文模板
英语四级考试写作图表作文模板图表作文模板Ascanbeclearlyseenfromthegraphtablechartgreat…
-
四六级写作预测及范文:图表题
四六级写作预测及范文图表题图表题AstayingathomeBtravelingCdoingsocialinvestigation…
-
20xx英语四级考试图表作文模板
图表作文常用句型Thegraphshowsthat图表显示Fromthechartweknowthat从这张表中我们可知Allth…