篇一 :雅思写作-小作文范文-表格
雅思小作文表格题写作技巧
雅思小作文中,表格题是经常出现的一种,也是相对比较简单的一种。那么雅思小作文表格题有哪些写作技巧呢?下面为大家整理了一种,
供大家参考,希望大家能够得到帮助。
雅思小作文表格题其实分为两种情况,所以小作文表格题的写作
技巧也就分成了两种。
雅思小作文表格题的第一种情况是其他图的改写,一般为曲线和
柱状图,当然还有饼图题。
得剑桥系列上有一个小作文的题,就是表格题,但是里面的内容其实就是变相的柱状图,写的是两个年年代的里的各种旅行的交通工具的受欢迎程度的变化,一般来说,如果遇到这种题的话,大家应该会毫不犹豫地选择直接把数据一写,这不是不对,但是就落入下乘了,同时大家可以看看范文,看范文是怎么写的,没错,范文描绘的对象并不仅仅是表格里的数据,更多的是每种交通工具的变化的大小,幅
度最大最小的那几个数据。
由此,我们可以得到这种表格题的解题方法。
1.先做出简单的四则运算,算出变化的大小。
2.排列这些大小,挑出最具代表性的对象。
3.以这些对象来写。
雅思小作文表格题第二种情况就是正儿八经的表格题,这类表格题没啥好说,直接写,也就是按照一个顺序把时间和内容交代清楚,但是记住是一个顺序,不要多个顺序,否则是写不出东西来的。 以上就是雅思小作文表格题的写作技巧的全部内容,大家可以按照上面的技巧在自己的雅思写作中予以应用,这样就可以更加提高大
…… …… 余下全文
篇二 :雅思写作小作文线形图表题(附范文)
雅思写作 – LINE GRAPH
WRITING TASK 1 (Test 2, Cambridge IELTS 7)
You should spend about 20 minutes on this task.
Write at least 150 words.
范文
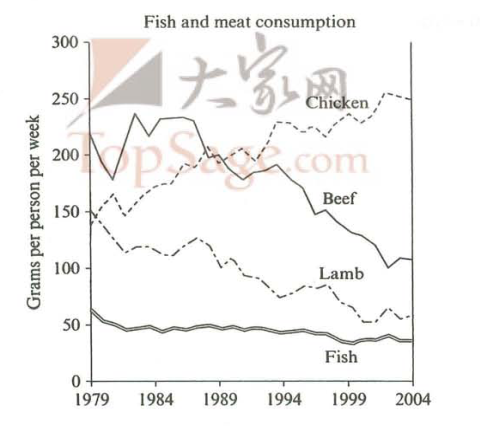
The graph illustrates changes in the amount of beef, lamb, chicken and fish consumed in a particular European country between 1979 and 2004.
In 1979, beef was by far the most popular of these foods, with about 225 grams consumed per person per week. Lamb and chicken were eaten in similar quantities (around 150 grams), while much less fish was consumed (just over 50 grams).
…… …… 余下全文
篇三 :雅思图表作文_A类雅思各类图表作文要点详解及范文
A类雅思各类图表作文要点详解及范文
一.曲线图
解题关键
1曲线图和柱状图都是动态图,解题的切入点在于描述趋势。
2在第二段的开头部分对整个曲线进行一个阶段式的总分类,使写作层次清晰,同时也方便考官阅卷。接下来再分类描述每个阶段的specific trend,同时导入数据作为分类的依据。
3趋势说明。即,对曲线的连续变化进行说明,如上升、下降、波动、持平。以时间为比较基础的应抓住“变化”:上升、下降、或是波动。题中对两个或两个以上的变量进行描述时应在此基础上进行比较,如变量多于两个应进行分类或有侧重的比较。
4极点说明。即对图表中最高的、最低的点单独进行说明。不以时间为比较基础的应注意对极点的描述。
5交点说明。即对图表当中多根曲线的交点进行对比说明。
6不要不做任何说明就机械地导入数据,这不符合雅思的考试目的。
曲线图常用词汇
动词—九大运动趋势
一:表示向上:increase,rise,improve,grow,ascend,mount,aggrandize,go up,climb, take off, jump,shoot up暴涨,soar,rocket, skyrocket
…… …… 余下全文
篇四 :雅思图表作文模板句
雅思图表作文模板句
时间:2007-11-13 16:54:31来源: 作者:
Para1. This is a table / chart / (line线状 bar柱状 pie饼状)graph which demonstrate / illustrate / reveal /depict /privide information about.............
Para2. (1)Obvious /Apparent from the graph is that ...rank the first/highest,while/whereas ....turn out to be the lowest
(2)It is exhibited/shown in the table that.....
(3)It can be seen from the table that.....
Para3.(1)饼.柱图 A,which accounts for...%,ranks the first;then next is B with...%;followed by C,constituting...%;finally it comes D.E.F at...%...%and...%respectively
…… …… 余下全文
篇五 :雅思小作文表格图攻略及范文
雅思小作文表格图攻略及范文
类型:
纵向比较—即自身前后的比较,具有历史性,可转为曲线图;
横向比较—与其他同类事物的比较。
原则:
首句永远概括全部;
中间永远找最值点描述;
最后总结概括
1.纵向比较:
题目:The table below gives information about changes in modes of travel in England between 1985 and 2000.Summarize the information by selecting and reporting the main features, and make comparisons where relevant.Write at least 150 words.
/"
target="_blank" />
范文: As can be seen from the table, walk and certain short-distance transportation, such as cycled and local bus tend to be less preferred. Of these, the local bus experienced the most dramatic decrease, from 429 miles to 274 miles within the 15-years period.
…… …… 余下全文
篇六 :雅思考试小作文表格,曲线技巧及范文
小作文
写作原则:
1. 客观:不要猜原因;不要做预测
2. 准确:roughly approximately
3. 概括
4. 详尽
5. 多样:词汇 语法 华丽
审题步骤:题目-标题-图表
开头段 – 转述题目
主体段 – 描述数据(进一步分段)
结尾段 – 总结规律
曲线图 C7P53
开头段:
正确;快速
below去掉;shows
主体段
分段原则:
1. 如果有最复杂的曲线,先写并单独成段
2. 剩下的曲线,找对比或类比关系
3. 如果还有剩下的,另起一段全部写完
beef段 – 复杂曲线段落 – 华丽的表达
c&l段 – 比较段落 – 清晰紧凑的段落层次
fish段 – 扫尾段 – 不同的写作风格
beef段
概括+详尽 – 简化图表
1. 静态数据的描述
2. 单一阶段的描述
3. 句子之间的衔接
4. 段落之间的衔接
1. 静态数据的描述
在1979年,牛肉的数量是220克。
In 1979, the amount of beef was 220 grams.
在1979年,关于牛肉的数据是220克。
…… …… 余下全文
篇七 :雅思写作小作文图表范文
雅思写作小作文图表范文
很多同学在开始看到雅思考试的小作文的时候无从下手,因为在我们国家的教育中对这方面的训练较少。不过,小作文真心有用啊!不仅在雅思考试中,更是在出国后的论文里面,毕业论文图表分析有莫有?理工科小作业图表分析有莫有?不信去问广大学姐学长啊同学们。
今天给大家展示一篇图表范文,同学们雅思考试准备前简单熟悉一下。
You should spend about 20 minutes on this task.
The graph and table below give information about water use worldwide and water consumption in two different countries. Summarise the information by selecting and reporting the main features, and make comparisons where relevant. Write at least 150 words.
The graph shows how the amount of water used worldwide changed between 1900 and 2000.
…… …… 余下全文
篇八 :雅思小作文范文--装置图 流程图 表格

小作文
流程图
The given graph indicates the procedures of glass bottle recycle by three main stages.
According to the table, various glass bottles are gathered in the collecting site and then transported to the cleaning station at the very beginning. Then it comes to the second stage where the bottles are washed by the high pressured water, after which they are categorized into Brown, Green as well as clear groups based on their color. After that, bottles are delivered to the recycling plant where the prepared bottles are burned in furnace with high temperature into liquid glass for recycle. Next, the recycled liquid glass along with new liquid glass is shaped into bottles again through glass moulds. Finally, the newly produced glass bottles are launched into the customer supermarket, till this point, the process of glass recycle is finished completely.
…… …… 余下全文