风电供电可靠性分析
A B S T R A C T
The analysis on reliability aspects of wind power finds more significance as compared to that in conventional power generation systems. In spite of the intermittent and variable nature of wind energy, it can be usefully tapped to generate electrical power for meeting part of the energy demand of the population. The present paper undertakes an analysis on the reliable aspects of wind energy conversion system and applies to seven wind farms in Muppandal region in India. For the purpose of analysis, two reliability indices are used; one is coined as the period during which the expected wind energy is not supplied and the other one is the loss of load expectation index which analyzes the degree of matching of wind farm power generation with the load model. The study also investigates the effect of increasing the hub height of wind energy conversion systems.
摘要
与传统发电系统相比,风电的可靠性分析更有意义。尽管风电具有间断性和不稳定性,但仍可以利用风电来满足部分人口对电能的需求。本文着重分析风电机组的可靠性并应用于印度Muppandal地区的七个风场。分析中应用了两项可靠性指标:一项是风电不供电期望,另一项是分析载荷模型与风场发电的相匹配时的失载期望指数。并对增加风电机组轮毂长度的影响进行了考查。
Keywords:
Reliability
Wind power
Loss of load expectation
Energy delivery factor
Availability
关键词:可靠性、风电、失载期望、供电特性、可行性。
Contents
1. Introduction
2. Description of wind farms taken for analysis
3. An overview of the definitions used for wind energy conversion system performance evaluation
3.1. Energy delivery factor
3.2. Expected wind energy not supplied
3.3. Loss of load expectation
3.4. Availability of a wind turbine
4. Reliability analysis of wind farms
4.1. Evaluation of expected wind energy not supplied
4.2. Evaluation of expected wind energy not supplied
4.2.1. Load demand curve
4.2.2. Analysis
5. Conclusions
References
目录
1. 前言
2. 本文所分析的风场的详细介绍
3. 风电机组性能评估所用术语的概述
3.1. 能量传递特性
3.2. 风场不供电期望(时间)
3.3. 失载期望
3.4. 风机的可行性指标
4. 风场可靠性分析
4.1. 风场不供电期望(时间)评估
4.2. 风场不供电期望(时间)评估
4.2.1.载荷需求曲线
4.2.2.分析
5. 结论
参考文献
1. Introduction 前言
The assessment of the reliability of wind farms in generation systems is essential from the planning point of view. Researches on the improvement in performance of wind power plants are getting importance as its application is increased rapidly [1–3]. The wind turbine generators in a wind farm will not have a fixed capacity distribution, owing to the constant variations in the outputs of each wind turbine output despite all of them being fed from the same wind energy source. Hence, a wind energy conversion system cannot produce power at its rated capacity throughout the year. Due to the partial availability of wind generated power, the actual capacity value of a wind power plant in a utility system is relatively low, which is equivalent to the wind power plant’s capacity factor multiplied by its rated capacity [4]. The relationship between the wind turbine power output and wind speed is non-linear and hence the power output characteristics of wind energy conversion system are different from that of any conventional generation systems. Even though wind energy is not consistent, wind power plants contribute to meet the energy demand requirements.
从计划的角度来说,并网发电风场的可靠性评估至关重要。风场性能改进与其应用同样重要,关于此方面的研究越来越多。尽管风轮处于同样的风能条件,但其输出总是变化的,致使风场中发电机的容量不恒定。由此,风电机组全年不可能按其设定容量发电。由于风力发电不完全可行,在役风场的实际容量相当低,相当于风场特性系数与其设定容量的乘积。风轮的输出与风速之间呈非线性关系,从而风电机组的能量输出特性与其他传统发电系统迥异。但是,虽然风电不持续,风场依然对满足电能需求具有一定贡献。
In recent years, wind energy based generation has witnessed an exponential growth in most developing countries. In India, several states have increased their wind energy penetration into the system grids to supplement the existing generation from conventional sources, namely, hydro and thermal options. It would appear that in view of the rapid growth of wind energy generation in India, this form of evaluation studies can help planners in understanding the scope, limitations and future of such systems in the Indian environment.
近年来,许多发展中国家大力发展风能产业。印度的诸多州郡已经实行风电入网作为传统水能、热能的补充。随着风电产业的迅猛发展,本文所提出的研究形式可以帮助决策者了解在现行印度环境中此类系统的发展空间、限制条件及前景展望。
As actual field data is needed for the analysis of reliable aspects of wind power, it is necessary to obtain this data from wind farms in India. Field data collected from a set of seven wind farms in Muppandal region of Tamilnadu, India, are used in this study.
出于风电可靠性分析的需要,我们有必要从印度风场获取这些数据。本文所用的数据源自Muppandal地区的七座风场。
2. Description of wind farms taken for analysis
The state of Tamilnadu is in the southern region of India at latitude between 8.5N and 13.35N and longitude between 76.15E and 80.20E. The geographical location of the state of Tamilnadu is favourable for wind power development due to the presence of major mountain passes along the western border of the state. This state is ahead of other Indian states with more than 50% of the total installed wind energy capacity of India. Tamilnadu state has experienced an encouraging response from the private sector ever since the inception of wind power in the country. It has a total installed wind turbine capacity of 4906.74 MW, of which 4887.34MW by the private sector and 19.4MW in the form of government demonstration projects [5,6].
2.分析中所选用的风场介绍
Tamilnadu州位于印度南部地区,东经76.15-80.20,北纬8.5-13.35之间。T州西临山脉,地理条件非常适于发展风电。该州风电装机总容量占印度全境的50%多,在诸州中位列第一。建造风电伊始,T州便从民用风电机中获益匪浅。该州风电装机总容量4906.74 MW,民用部分占4887.34 MW,政府示范项目占19.4 MW。
The Muppandal region in Tamilnadu has the distinction of having one of the largest concentrations of wind turbines at a single location. In this region, wind farms are spread along the national highway from Muppandal to Kanyakumari, at the confluence of the Bay of Bengal, Arabian Sea and the Indian Ocean. The Aralvaimozhi mountain pass strengthens the winds of South-West monsoon, which blow from May to September and reaches a maximum wind speed of 30 m/s. The annual average wind speed in this area is 6–7 m/s.
T州M地由于拥有单机容量最大的风机而闻名。该地位于印度洋、阿拉伯海和Bengal湾交汇处,风机安装在M-K高速治线。A山脉加强了5月到9月的西南季风,便之最高速度达到30m/s。该地区年平均风速6-7m/s。
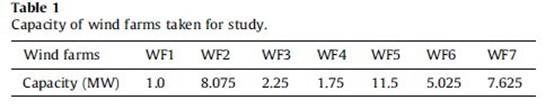
The field data used for this study are from seven wind farms in Muppandal, Tamilnadu, India, for a period from April 20## to March 2005. The data covers 135 wind turbines with a total capacity of 37MW from the seven wind farms and the details are given in Table 1. The data is intended to be typically representative of that of an Indian wind farm located in a region of high wind potential. The capacity of the selected wind farms ranges from 1 MW to 11.5 MW. Energy generation from each turbine, generation hours, machine maintenance and breakdown hours, grid maintenance and breakdown hours, wind speed and economic parameters are the main variables collected from these wind farms.
本文所研究的风场数据源自印度T州M地风场从20##年4月至20##年3月的记录。这些数据含概了七座风场中总装机容量37MW的135组风机运行参数,详见表1。
这些数据可以作为印度风能潜藏量丰富地区的典型案例。七座风场装机容量从1MW到11.5MW不等。所选取的主要参数包括:单机发电量、发电时间、机械故障及维护时间、风速、经济指标等。
 3. An overview of the definitions used for wind energy conversion system performance evaluation
3.风电机组性能评估所用术语的概述
3.1. Energy delivery factor
The key performance measure of any power plant is the electric energy it delivers over the year. The quantity of energy delivered depends on the rated power capacity of the plant and depends on how fully that capacity is utilized. The normalized measure of the wind power plant performance is the energy delivery factor (EDF) which is also called as capacity factor [7,8]. The energy delivery factor reflects how effectively the wind turbine could harness the energy available in the wind spectra. The annual energy delivery factor is given as:
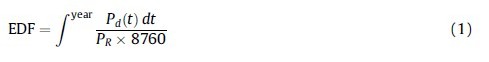
where PR is the rated capacity of the wind turbine, Pd(t) is the power delivered to the grid at any given time t.
3.1.衡量电厂性能的重要数据是年供电量。供电量取决于额定容量及其利用度。常规的手段是检测其供电特性(EDF),也叫容量特性,它反映在可发电风速范围内风机对风能的利用效率。年均供电特性表达为:
其中PR是风机的额定容量,Pd(t)是任意给定t时刻其对电网的供电量。
In the present study, the energy delivery factor is analyzed on daily as well as monthly power generation from the seven wind farms. The wind generated power varies every instant and hence it is necessary to examine its reliable production for a utility industry, how much to be dependent on daily or monthly basis.
本研究按天或按月分析七座风场所发电量的供电特性。由于风力发电的瞬变性,因此检测工业用电使用风电的可靠性以及每天或每月多大程度上使用风电十分必要。
The energy delivery factor incorporates the energy conversion efficiencies of various components of the wind turbine and the availability of wind and wind turbines. From a study of the available data on the wind farms, it is seen that the wind farms considered for study operate at an average annual EDF of around 21%. It must be understood that the wind farm EDF varies with the season, having higher values during the windy period and lower values during less windy periods of the year. Fig. 1 shows wide variation in the energy generation, with EDF’s ranging from 0.297% to 66.48% in a year.
风电机各部件间的机械效率和风场及风轮的可靠性共同决定了供电特性。
从对几座风场的可靠数据的研究中发现,风场的年均EDF约为21%。必须指出,风场的EDF与季节息息相关,多风季节数值较高而少风季节则低。图1表明风电EDF一年中的变化范围,从0.297到66.48%。
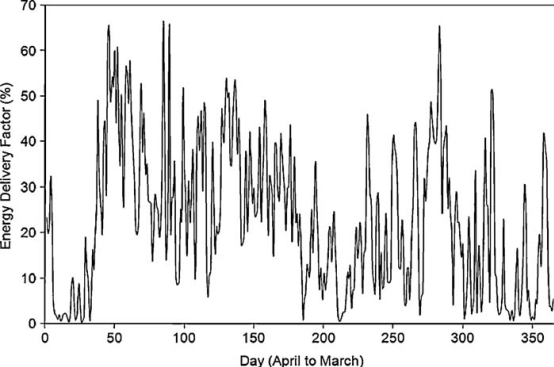
图1 随风能波动的日供电特性
3.2. Expected wind energy not supplied
The reliability of the wind power plant is evaluated by an index coined for the purpose called expected wind energy not supplied (EWNS). This index gives the expected period during which the total generation capacity (taken in terms of daily or monthly energy delivery factor) not exceeding a given power level (taken in terms of annual energy delivery factor).
The EWNS is given by:
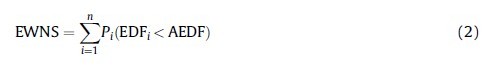
where i is the time step, a day or a month, n is the number of days or month, EDFi is the energy delivery factor in time period i, AEDF is the annual energy delivery factor and Pi(EDFi < AEDFi) is the probability that the annual energy delivery factor exceeds the energy delivery factor in time period i.
3.2. 风场不供电期望(时间)
风电可靠性的另一项评估指标是风场不供电期望(EWNS),该指标表示某时段发电总量(日或月供电特性参考在内)未达到既定水平(日或月供电特性参考在内)。
其表达式如下:
EWNS= (2)
其中i表示单位时间,日或月;n表示单位时间的数量;EDFi是第i时间段内的供电特性;AEDF是年均供电特性;Pi(EDFi < AEDFi)表示单位时间i内的供电特性未达到年均水平的概率。
3.3. Loss of load expectation
The reliability of wind energy conversion systems can be
evaluated by the index, loss of load expectation (LOLE). LOLE is the expected period during which the load demand exceeds the available generation capacity [9–13].
The LOLE is defined as:
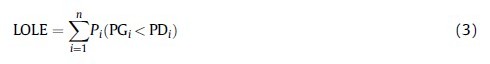
where i is the time step, an hour or a day, n is the number of hours or days, PGi is the power generation available in time period i, PDi is the load demand in time period i and Pi(PGi < PDi) is the probability that the load demand exceeds the available power generation in time period i.
3.3.失载期望
失载期望(LOLE)可用来衡量风电机组的可靠性,它表示某时段的电网需求超过额定载荷。定义为:
LOLE= (3)
其中i表示单位时间,日或小时;n表示单位时间的数量;PGi表示单位时间i在功率允许范围内;PDi表示单位时间i内电网需求载荷;Pi(PGi < PDi)表示单位时间i内所需载荷超过额定载荷。
3.4. Availability of a wind turbine
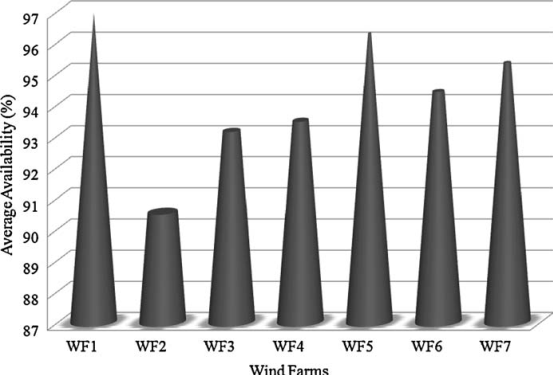
The ‘availability’ of a wind turbine refers to the percentage of time it is in a position or state for generating power. Servicing, inspection, component failures and accidents, such as lightning strokes reduce the availability of wind turbine. The availability of each wind turbine in a wind farm may differ depending on the net period of time for which it is functional in regard to power generation [14]. Grid breakdown and maintenance period are included in the calculation of availability factor since grid failure results in stalling of wind turbine. Data pertaining to the up and down times of the various turbines in the seven wind farms is used to estimate the availability that is given by Eq. (4). Fig. 2 shows the average availability of the seven wind farms.

3.4.风机的可行性指标
这里的可行性指标表示某地区风机可以发电的时间比。维护、检查、部件损坏及事故(诸如雷击)等原因都将降低该指标。由于风场中各风机净发电时间不同其可行性指标也不同。电网故障及维护造成风机停运,此时间也要考虑到可行性指标中。七座风场各风机运行和非运行时间的相关数据按公式(4)计算其可行性指标。图2显示了七座风场的平均可行性指标。
4. Reliability analysis of wind farms
4.1. Evaluation of expected wind energy not supplied
The reliability analysis is carried out for two cases. In the first case, the reliability evaluation is done with daily energy generation data and in the second case with monthly energy generation data. The capacities and annual energy delivery factor of the seven wind farms are given in Table 2.
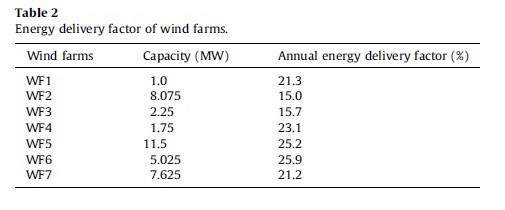
In the seven wind farms taken for study, wind farm WF6 shows the highest annual energy delivery factor of 25.9%. Even though the wind farms are sited in the nearby locations, the energy delivery factor differs in each wind farm. This may be due to site specific factors such as strength of wind spectra, machine efficiency. The study is extended to investigate the effect of increase in hub height of the existing wind turbine in the two cases.
4.风场可靠性分析
4.1. 风场不供电期望(时间)评估
该可靠性分析有两种情况:一种是以每天的发电数据进行可靠性分析,另一种是以月发电数据进行的。七座风场的容量及年均供电特性如表2所示。所研究的七座风场中,风场WF6以年均25.9%的供电特性居高。虽然七座风场地理位置相距不远,但供电特性各不相同,这可能是诸如风速及机械效率不同造成的。本研究探讨了在两种情况下提高现存风轮轮毂高度的影响。
Fig. 2. Average availability of wind farms.
For the first case, the number of days the expected wind energy not supplied is evaluated and is given in Table 3.
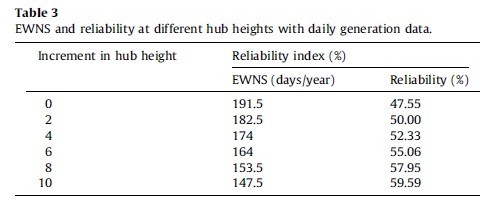
The results obtained show that the expected wind energy not supplied in a year is 191.5 days and a wind energy conversion system is 47.55% reliable in meeting the expected wind energy.
第一种情况中,不供电期望的天数评估如表3所示。所得结果显示,不供电期望时间是191.5天,满足该期望的风电机组的可靠性是47.55%。
To enhance the reliability of wind power plant, it is necessary to improve the overall performance of the plant. The reliability index can be improved if the amount of energy generation increases. A change of many parameters in an existing wind farm may not be cost effective. Therefore, the analysis is carried out by increasing the hub height of the existing wind turbine which increases the power generation. As the hub height increases the rotor blades are exposed to higher wind speeds, since the wind speed increases with altitude. The average wind speed measured at a given height is related to the average wind speed measured at another height in the same vertical plane and is given as [15]:
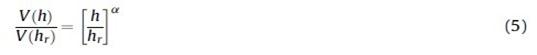
where V(h) is the wind speed at the height h, V(hr) is the wind speed at the reference height, hr and α is the power law exponent and is taken as 0.3. The exponent α is an empirically derived coefficient that varies with parameters such as surface roughness, wind speed, temperature [15]. Assuming that there is no variation in air density and the blade diameter, the power generation at given height, P(h), can be expressed as
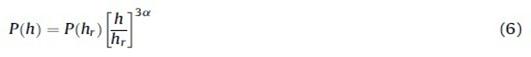
where P(hr), is the power generation at the reference height.
为了提高风电机组的可靠性,有必要全方面改良机组性能。通过增加发电量可以提高可靠性指标。现存风场的诸多参数改变未必影响其效率,故本文针对以提高轮毂来增加发电量的方法进行研究。由于风速随着高度的升高而增大,提高轮毂可以使风轮叶片捕获更高的风速。同一地点风速与高度存在一定关系,如下式所示: (5)
其中V(h)是高度为h处的风速;V(hr)是同地点参考高度hr的风速;α是幂指数,一般取0.3,它是一个经验系数,与地表粗糙度、风速、温度等参数有关;假设空气密度和叶片半径不变,发电量设为P(h),则P(h)可表述为:
(6)
其中P(hr)是在参考高度的发电量。
The hub height of the wind turbines in the wind farm is incremented in steps of 2 m for simulations. The obtained reliability index is given in Table 3.The increase in hub height shows that the reliability index, EWNS decreases in each step, thus representing an improvement in reliability. The analysis shows that the reliability improves to an average of 12.04% with increase in hub height of 10 m.
模拟中风场的风轮轮毂高度每次提升2m。测得的可靠性指数如表3所示。可以看到随着轮毂高度的递增EWNS递减,从而可靠性改善了。分析表明轮毂提升10m时可靠性平均提高12.04%。
In the second case, the number of months the expected wind energy not supplied is evaluated. The results obtained show that at the base hub height, the expected wind energy not supplied in a year is 6.9 months and a wind energy conversion system is 42.2% reliable in meeting the expected wind energy. The increment in the hub height analysis is also carried out with monthly generation data. Table 4 gives the reliability index at different hub heights. Tables 5 and 6 give the EWNS index obtained for all the seven wind farms separately and the EWNS index for the three years for which the data are collected.
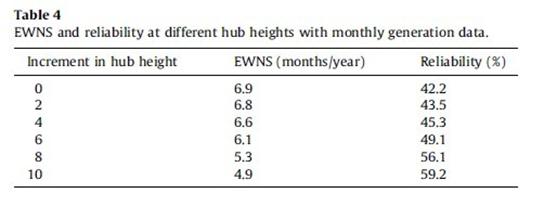
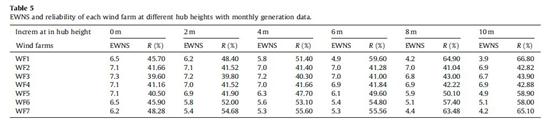
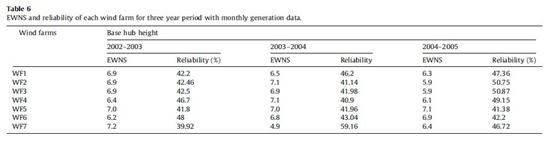
第二种情况,不供电期望按月评估。所得结果显示,轮毂在基本高度时不供电期望月数是6.9个月,与之相应的风电机组可靠性是42.2%。同样对轮毂高度提高按月发电数所进行了分析。表4给出了不同高度时的可靠性指数,表5和表6分别给出了所测得的七座风场各自的EWNS指数和所选取的三年数据中的EWNS指数。
4.2. Evaluation of expected wind energy not supplied
The chronological hourly generation data for each month of the wind farms is compared with load demand of a chronological hourly load demand model. The total installed capacity of the seven wind farms from which the data are collected is 37 MW. The maximum hourly average power generation from these seven wind farms is 15 MW, which is 40% of the installed capacity. This power generation is somewhat low in comparison with the rated wind farm capacity, mainly due to the stochastic nature of wind, availability of wind turbines and grid etc.
4.2不供电期望评估
几座风场每月的发电数据与相应的载荷需求逐小时进行比较。采集数据的七座风场总装机容量37MW。七座风场最大时平均发电功率是15MW,占总容量40%。此发电量与风场额定容量相比较低,主要由于风的随机性,机组和电网的可行性等。
4.2.1. Load demand curve
For the reliability estimation, information of the load curve is essential. Since the wind farms are located in Muppandal in the state of Tamilnadu and feed the state grid, it is appropriate to apply the analysis to the load demand curve for the state grid. The actual state grid is supplied with power from sources of generation other than wind power. Hence, to isolate the contribution/impact of the wind farms alone, it became necessary to scale down the state grid such that the peak demand of the grid corresponds to that associated with the wind farms. The load curve as applied to the evaluation of the reliability of wind farms therefore is derived by scaling down the actual load demand curve pattern. The peak load demand is taken as 15 MW, which is equal to the maximum hourly average power generation. The obtained load curve for the study is of the similar trends of the state grid load curve, but with magnitude reduction. Fig. 3 shows the load curve for the reliability evaluation. The LOLE index is obtained by comparing hourly average generation of each month with the corresponding hourly load demand.
4.2.1载荷需求曲线
为了可靠性估计,绘制载荷曲线信息很必要。由于风场座落在T州M地并向电网供电,可以应用电网需求曲线进行分析。实际上,不单单是风场向电网供电,因此,为区分出风场单独的供电量,有必要按比例缩小电网的数据以使电网的峰值需求与风场的峰值相一致。这条载荷曲线用于估计风场的可靠性,因此它只是按比例缩小了实际的载荷需求曲线样版。峰值载荷需求设为15MW,与风场最大的时平均发电功率相同。所得到的研究曲线与电网载荷曲线走势相近,但其坐标要小得多。图3给出了用于可靠性估计的载荷曲线,LOLE指数的标定按时平均发电量与载荷需求相同
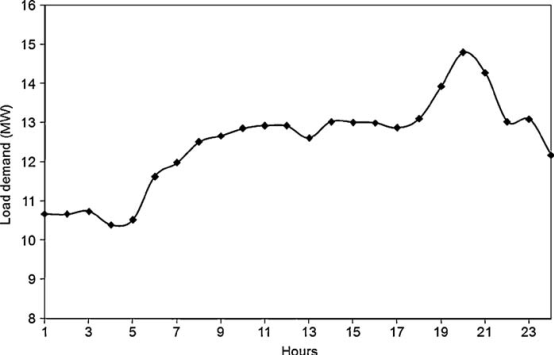
图3 应用于可靠性分析的比例缩小载荷曲线
4.2.2. Analysis
Table 7 shows the LOLE in hours per year and the reliability in
percentage. The percentage reliability (R) is calculated as given below:
Reliability (7)
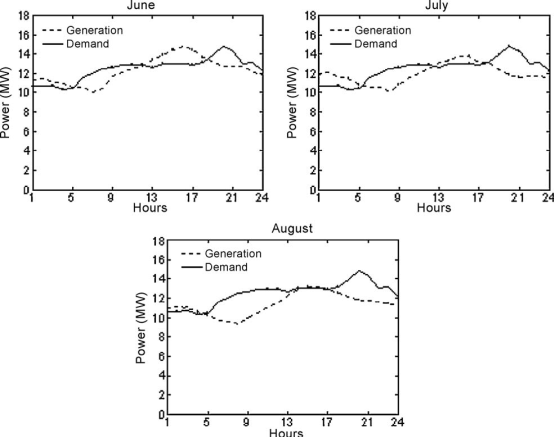
When the peak load demand is assumed equal to the maximum hourly average power generation, which is 40% of the total installed wind power capacity; the loss of load expectation index is obtained as 261.77 h/year. This means the wind farm reliability contribution is 9.11% in meeting the load demand. A very low value of percentage reliability is obtained, because the hourly power generation is higher than the demand only for a few hours in the months of June, July and August. This is shown in Fig. 4.
The analysis is done further by scaling down the load demand profile to achieve 50% reliability in meeting the load demand. Hence the peak load demand is decreased by 5% in each step. The LOLE index and the corresponding percentage reliability are shown in Table 7.
When the peak load demand is 20% of the total wind power capacity, the reliability of 53.29% is obtained. The profiles of wind power generation and load demand at 20% of the total wind power capacity May, July, September and December are shown in Fig. 5.
4.2.2.分析
表7按小时给出了每年的LOLE指数和可靠性(%)。可靠性(%)(R)如下式计算:
R= (7)
这里假定峰载需求与时平均发电量相同,等于风电总装机容量的40%;得到的失载期望指数是261.77h/year。这说明满足载荷需求的供电可靠性是9.11%。这个数值之所以很低,是因为只有在六、七、八月某些时段的时发电量高于需求。如图4所示。此分析又将载荷需求曲线按比例缩小到能有50%可靠性满足载荷需求。此时峰载需求下降了5%。失载期望指数和相关可靠性列于表7。当峰载需求为装机总量的20%时,可靠性是53.29%。图5给出了5月、7月、7月、11月的风电发电量和需求量为总容量的20%时的曲线。
It can be seen from Fig. 4, how the hourly, monthly and seasonal variation of wind speed affects the wind power generation and thereby its reliability. The highest wind power system performance is during the month of June, July and August. It is noted that throughout the year, a base power generation of 5.5% of the total wind power capacity is available from the wind farms. Another feature of wind energy to be noted from this study is that during off peak hours in demand, the wind power generation is high and during peak hours the wind power generation is low. The wind power generation is higher than or equal to the load demand for certain period of the day, but the time of the day does not match with the demand and so the demand is not met effectively. This signifies that the wind energy must be considered only for meeting part of the base load while integrating with the conventional systems. The analysis also shows the hours during which the power generation is high and low, and accordingly the energy planners must handle the reserves in power system.
从图4可以看出,风速变化影响发电量进而影响供电可靠性。6-8月机组表现量好。可以看出,全年以总装机容量的5.5%作为基数是可行的。另一个明显的特征是非峰期风电发电量大而峰期发电量小。风电的发电量在一天的某些时段高于或等于需求量,但是与需求曲线不匹配,所以不能有效的满足需求。因此风电并网时只能要求其满足一定的基数。本分析还显示出发电量的高低变化,决策者必须处理好电网中的这种波动。
In case of stand-alone or hybrid systems, the analysis signifies the role of storage systems. The energy surplus can be stored in batteries or other means, in order to be used during time of insufficient wind energy production or sold to the utility or for other purposes. Reserved energy in storage systems can be instantaneously used as back-up, if the energy supply is significantly reduced by the random changes in wind speed. In addition, the storage can also help to reduce the utility of other sources for peak hour’s requirements by storing energy in times of low demand and using it in peak hours.
除了独立的或混合型的网络,本分析还指出了存贮电能的作用。剩余的电量可以用电池或其他方法存起来,用于风电不足时或作为其他用途。存下来的电能同时可以作为备用,以防由于风速的随机变化引起风电减产。另外,存下来的电能还可以减少其他类发电量,即在谷载时存起来用于峰载。
The improvement in reliability by increasing the hub height of wind energy conversion system by 10 m is investigated. The relationship between the hub height and wind speed is given in Eq. (5).

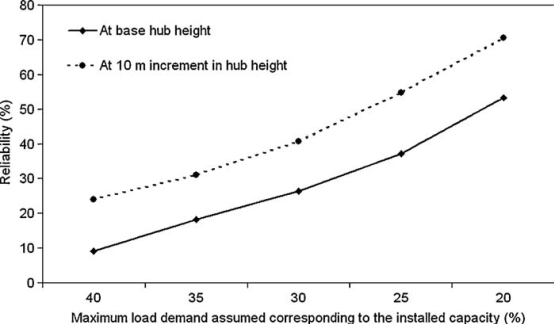
The results are presented in Table 7. Figs. 6 and 7 show the comparison of wind power generation at increased hub height of 10 m and load demand for the months of May, July, September and December, when the peak load demand is assumed as 40% and 20% of the total installed wind power capacity. The LOLE index decrease as the hub height is increased, thus showing improvement in the reliability. Fig. 8 shows the reliability curves with base hub height and 10 m increment in hub height.
本分析还考查了采用提高轮毂(10m)的方法改善可靠性。轮毂高度与风速的关系如方程5所示。结果如表7所示,图6和图7分别是峰载需求设定为总装机容量的40%和20%时,轮毂提高10m后5、7、9、11月份的发电量。轮毂提高失载指数下降,由此可靠性有所改善。图8对比了基础轮毂高度与提高10m后可靠性曲线。
5. Conclusions
It is important that a power system should provide a reliable electric power to the consumers. Determination of appropriate generating sources is essential to meet the expected total demand.
电网供电的可靠性非常重要,发电资源的合理配置对满足需求来说更是十分关键。
While operating wind energy conversion systems with the other sources, it is necessary to know when and how much power will be available from wind in order to satisfy the load demand. This evaluation study is helpful to energy planners and operators in planning and decision-making.
风电并网时有必要了解其发电时间和发电量的可靠性以满足电网需求。本论述有助于决策者和操作者计划和决策。
A wind energy conversion system does not represent an equivalent amount of its existing installation capacity. With the index of EWNS, an analysis is carried out for the study of reliability performance of wind energy conversion systems in meeting the annual energy delivery factor. The reliability contributions with daily and monthly generation data are obtained as 47.55% and 42.2% respectively to meet the annual EDF. The study also reveals that hub height is positively correlated to improved wind power plant reliability.
风电机组的发电量不等同于其装机容量。有了风电不供电期望指数,我们可以根据风电供电特性分析风电系统的可靠性。按供电特性得到的日、月发电可靠性分别是47.55%和42.2%。本研究还揭示了提高轮毂高度对改善相关机组的可靠性有利。
With the evaluation of LOLE, it is seen that the reliability contribution of wind farms is 53.29% when the peak load demand is assumed as 20% of the installed wind power capacity. It is found that there is no matching of peak load period with the maximum wind power generation period. However, the total energy contribution by the wind farms to the power system is significant. Therefore in a power system, wind generated power, if available, must be utilized to the maximum to meet the base load demands and thereby conserve conventional fuels and to reduce emissions.
对失载期望指数的评估显示出,当峰载需求设定为总装机容量的20%时风电机组的可靠性为53.29%。同时发现发电量的峰值与需求量的峰值不匹配。然而,风场的发电量对电网是有积极贡献的。因此,对于电网来说,应尽量最大程度的利用风电来满足需求,与此同时节约了传统能源并减少了排放。
-
供电可靠性分析报告
供电可靠性分析报告专题会议记录时间20xx年12月20日8001100地点三楼会议室参加会议人员主持人按照局工作会议要求我局于20…
-
供电可靠性分析报告
分公司20xx年供电可靠性总结一主要指标完成情况20xx年供电可靠率下达指标为RS39965完成9965用户平均停电时间下达指标为…
-
供电所供电可靠性分析报告模板
供电所供电可靠性分析报告模板供电所年月供电可靠性分析报告时间年月日地点供电所会议室参加会议人员主持人按照县局工作会议要求我所于年月…
-
供电可靠性分析报告
上犹县电力公司7月份用户供电可靠性分析报告一主要指标完成情况表1中压用户供电可靠性指标汇总表7月7月份公司综合供电可靠率99853…
-
供电可靠性分析报告
供电可靠性分析报告作者未知文章来源未知更新时间20xx年03月24日我要评论0内容预览专题会议记录生产技术部20xx年1月17日时…
-
供电可靠性分析报告
供电可靠性分析报告作者未知文章来源未知更新时间20xx年03月24日我要评论0内容预览专题会议记录生产技术部20xx年1月17日时…
-
供电可靠性的管控与分析
供电可靠性的管控与分析摘要随着我国社会经济的不断发展我国的人们以及各行各业对于电力的需求也越来越大作为一个国家最重要的基础产业电力…
-
供电可靠性分析报告
供电可靠性分析报告专题会议记录时间20xx年12月20日8001100地点三楼会议室参加会议人员主持人按照局工作会议要求我局于20…
-
供电可靠性分析报告
上犹县电力公司7月份用户供电可靠性分析报告一主要指标完成情况表1中压用户供电可靠性指标汇总表7月7月份公司综合供电可靠率99853…
-
第一季度供电可靠性季、年度分析报告
陕西省地方电力集团有限公司SHAANXIREGIONALELECTRICPOWERGPOUPCOLTD20xx年第一季度供电可靠性…