雅思图表作文分析
回顾近两个月的雅思考试,表格图的出现频率有所上升,在4月底至5月底,甚至出现了连考三次的情况。许多学生都表示对这种图表心存恐惧,研究中心分析认为主要源于以下几个原因:1)表格图包含数据较多;如果将数据进行逐一列举,句式显得单调且对数据缺乏分析,势必影响得分。2)数据涉及分类层次复杂;在短短的几十分钟里,很难迅速对表格做出准确而得当的分类并选择典型值。根据以上两个令学生望而却步的症结,可以得出表格题的核心在于:分类及典型值的抓取。
根据教学中观察的大量图表以及高分范文的分析,将表格图分成了几个类型并对其进行总结和分析,希望帮助学生更系统更准确地把握表格图的特征:
1 有时间因素的表格图
此类图表包含时间因素,常常是反映一些方面的变化和发展,如下图:
The table below shows the consumer durables (telephone, refrigerator, etc.) owned in Britain from 1972 to 1983.

该图表展现了十年间英国家用电器拥有率,以时间和不同电器种类作为主要因素进行对比。这种图表内容较为单纯,很容易让人联想到一类较为简单的图表 —— 线图。我们就来看看是否能够将其转化为线图。
对图表进行横向分析,发现我们可以借助线图的趋势表达来描写各电器百分比的变化,但同时也会陷入一个误区,即面面俱到,对每次变化都进行说明,许多学生会不断重复上升下降等句子,对自己的作文心存疑虑。实际上,对于这种图表,我们只需观察总趋势即可,将首尾年份进行比较,得出几乎所有的电器的家庭占有率都呈上升趋势(Video除外)。至此为止,我们只完成了图表分析的其中一步:典型值的抓取。
对图表的分类来自于图表设置的最初理念,对各电器之间进行对比,这就需要我们对图表进行纵向分析,对于这种相同趋势的图表,这里可以借助线图的另一个要素 —— 变化幅度。从上至下的幅度计算分别为25%, 5%,8%,21%,14%,2%,35%(video除外),思路就更为清晰,即按照快速上升,平稳上升及缓慢上升进行对比。我们可以将图表架构理清如下:按照变化幅度进行分类,分为两至三类;在细节描述时抓取首尾典型值进行说明。
我们可以练习一下这种分类方法,请观察以下表格:


同样地,该图表也包含时间因素,对各国的参观者人数进行对比。鉴于各国人数在十年间均呈上升趋势,我们仍然可以按照变化幅度大小进行分类。
总结:对于包含时间因素的表格图,建议考生可以将其转化为线图,按照其变化趋势(上升,下降,平稳)进行分类,如果趋势变化相同,可以根据其变化幅度进行分类(快速,平稳,缓慢)。选取能够反映分类特征的典型值即可。
2 有地域因素的表格图
该类图表常常包含有国家或者城市名称这些地域因素,并从不同方面进行对比,如下图:
The table below shows social and economic indicators for four countries in 1994, according to United Nations statistics.

此类图表常包含有国家或者城市名,对某个方面进行对比,如各国的经济发展水平,国民健康水平,教育水平等,这些经济和社会因素反映了各个国家的发展程度。可以预见,相似发展程度的国家或者城市,数据会呈现相似的情况,我们可以将其作为分类的标准。
就上图而言,我们应该对其进行横向比较,否则各个国家之间孰优孰劣就无从谈起。第一个因素为人均收入(美元计算),显而易见,日本的数据遥遥领先,其次为加拿大,秘鲁和扎伊尔。这里可以借助排序段,对其按照从大到小进行说明即可。当然也可以将其分成大小两组,再选取各组有代表型的数据如日本及扎伊尔的数据作为例证。第二个因素为出生时人均寿命,我们同样将相似的数据进行分类,选取最小值或者最大值进行重点说明。可以说明前两个国家寿命都接近80岁,而后两者只在50岁上下。同样,后面两个因素(人均卡路里摄取量和成人受教育水平)也可以按照这种办法进行说明,当然最后一项教育水平中,扎伊尔的数据(34%)需要被列举,这样就能更好地迎合出题者的意图。
我们仍然练习一下这种图表的分类思路,请见下图

该图主要比较各国之间休闲活动在不同国家30-50岁人群中所占的百分比,由于地域因素和刚才图表设置不同,我们按照纵向进行对比,很容易发现澳大利亚的各项值都十分典型,(除reading项外),按照这一思路,我们只需挑选出每个休闲活动中有代表性的国家和对应数值进行详细说明,其他数值概括一下即可。
总结:此类图表建议考生应按照地域进行比较,并根据数值大小对数据进行分类,再抽取较大或较小的典型值进行说明即可。
小作文是解说文性质的书面产出,不同于一般的记述,除了要把其中的数据表达出来,更重要的是要进行分析。如果小作文写成纯粹的数据罗列,也就是我们常说的一锅粥,是不可能得高分的。
常见的小作文的逻辑分析方法包括:总分、比较(类似比和相反比)、分类、因果、时空和过程分析等。
总分逻辑主要用于写pie chart 等,开始时要介绍一下总共有的项目数,其他图表中也可能会用到总体趋势分析,如线图中某一条线可能整体上升、下降或持平,但其中基本都会有某一个点是例外,常见的句型可以把总趋势作为主句,后面接独立主格或者with结构。
比较逻辑是大部分学生很会用的,无论是类似还是相反比较,只是要注意用稍微复杂点的句式。如表示两个项目很类似,大部分同学会把第一项用一个简单句写出来,然后第二个句子前面加上Like A, B also …。而要表示相对照,一般就会想到用but。除了句式的复杂,更要注意比较的每个句子尽量不要写成一样的形式,或者全部写成原始数据的积累,可以先找一个基准点,用一个句子把其中的数据写出来,第二个与之相比较的句子可以写比其稍高、多…%或者是几倍或几分之几。
对于图表中的数据较多,一般要用到分类,可以根据大体趋势如增多、减少、频繁变化或者几乎不变分成几个大类。几乎每个数据都罗列出来的文章也得不到高分,一般我们建议大家不要列出4项以上。其实每次考试中不论哪种图表几乎都至少有一个特殊点,这就和前面的总趋势加一个单点是一样的。
图表中有时候会有原因分析,这种情况下原因是一组要分析的数据,必须要写。但小作文忌讳把图中的信息粗略写完,加上大量的自己的主观评价,多数考生会根据自己的臆断写出原因分析,这样有悖于解说文的客观陈述的本意而成为议论文。根据考生回馈失分较重。
地图或流程图不同于一般的数据图表,可能更强调空间和时间的逻辑分析,所以写这两种图表时要尽量以空间的转移或者过程的衔接为线索。此外总分、比较等逻辑也应体现在其中。
总之,写作和口语其实都很注重逻辑分析,条理清楚的文章更为考官青睐。
6月13日雅思写作图表作文真题曝光(附高分范文)
You should spend about 20 minutes on this task
The graphs below show the age structure of a European country from 1901 to 1981 and a prediction for 2021.
Summarize the information by selecting and reporting the main features, and make comparisons where relevant.
You should write at least 150 words.

Sample Answer
The graphs compare the population makeup of one European country every forty years from 1901 to 1981, and the estimated number in 2021.
There was a huge increase in the number of people in this country from 38,225,000 in 1901 to 67,180,000 eighty years later, and this upward trend is expected to last through to the year 2021, when the population is estimated at 87,658,000, more than double the 1901 figure.
In 1901 and 1941, the population structure in this country was completely the same, with an overwhelming majority of its population (95%) below 65, 4% between 65 and 85 and only 1% over 85 years old.
However, the year 1981 saw a sharp increase in the percentage of the elderly. Altogether, they made up 17% of the total population, whereas the projection for the year 20## shows that they will continue to grow but less dramatically to 20% of the total population (15% for 65-85-year-olds and 5% for over-85-year-olds).
In summary, changes are taking place not only in the number of people but also in the ages of the people who constitute the population in this European country, indicating it is advancing into an aging society.
第二篇:雅思A类图表作文题写作精华提炼分析
雅思A类图表作文题写作精华提炼分析
数据图:
一、介绍段introduction:
介绍段内容几乎完全不用创新,就是对题目文字部分的第二段做改写,paraphrase the rubric。所谓改写,要么换词,要么换句式。
例如:(I4-100)
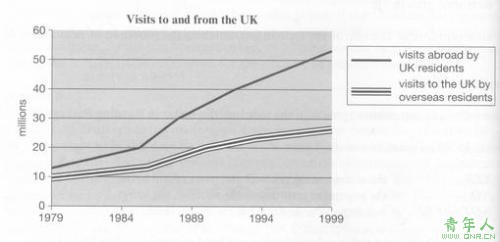
The charts below give information about travel to and from the UK and most
(1) (2)
popular countries for UK residents to visit.
换词
(1)图 The charts
图:chart, graph, diagram(雅思写作中完全等价,无差别)
线:line / curve chart
柱图:bar / column graph
饼:pie diagram
表:table / statistics / figures
(2)动词“表明”give information about
介绍段是客观描述,用一般现在时态,give information about虽然在这篇作文中最好不再用,但是informal learning,随手学到的东东,留作其它文章再用。替换的词语和结构很多,比如我常用的reveal / indicate / demonstrate,大家也可以选几个自己喜欢并且拼写准确的形成风格,年轻时多尝试,年纪大了就要形成风格啦,三个就够,多了白搭,还是那句话,博大不如精深。
第二段其余部分的替换因题而异,比如travel换成visit,the UK换成Britain(注意不是England,英格兰只是Britain的一部分),popular换成fashionable,country换成nation,UK residents to visit换成UK tourists。不过随着练习作文数量的增加,你会惊喜的发现,雅思图表作文,连描述的对象都是类似的。
最后要注意点细节,原文的“below”应省略,因为答题纸上没有图;而第二副图上标注的1999年,可以补充进介绍段。对担心写不足词数的单图作文,甚至还可以“猥琐”的把特征点概括成一句话加入介绍段。
换句:
(1)并列句:
The line chart reveals that … and the bar graph indicates that …(分别描述两幅图,形成风格哦,第一幅图用chart,第二副图用graph,第一幅图reveal,第二副图indicate,也许你写的所有文章都类似,但考官只有机会欣赏一篇啊。)
(2)被动语态:
… is revealed in the line chart and … is indicated in the bar graph.
One possible answer:
The line chart reveals visits to and from Britain and the bar graph indicates most fashionable nations for UK tourists in 1999.
二、主体段body:
过渡:
段首过渡词(1个)
信息出处:
According to the line chart,
As is shown in the line chart,
The line chart shows that …
表示逻辑:
On the other hand等等
段内过渡词(1-2个)
顺承:also, besides, in addition
转折:however, on the other hand, conversely
其它:meanwhile / in the same time, similarly, in particular
句型:
简单线图
简单线图:
趋势(包括升降速度):
The visits increased quickly from about 12 to 53 million from 1979 to 1999.
(1) (2) (3) (4) (5)
There was an increase in the visits from about 12 to 53 million from 1979 to 1999.
(2a) (1) (4) (5)
An increase in the visits is seen from about 12 to 53 million from 1979 to 1999.
(2a) (1) (6) (4) (5)
(1)主体:(第二段或图例中有明示)
同义词 travel
The travel increased quickly from about 12 to 53 million from 1979 to 1999.
代词 they
The visits increased quickly from about 12 to 53 million from 1979 to 1999. In particular, they increased very rapidly from 1985 to 1988.
线 line:主要用于不理解图线所代表内容的情况。
the thin(细线) / thick(粗线) / broken(虚线) / dotted(点线) line
The thin line, which represents visits by UK residents, increased from about 12 to 53 million from 1979 to 1999.
(2)增加/减少:动词
increase / decrease, rise/drop(可做名词)
go up / come down
climb / slide
ascend / decline
rocket / collapse(暴增/暴减)
过去的图表用一般过去时;一天24小时的图表用一般现在时。
(3)升降速度/幅度(去掉-ly就是形容词)
快:quickly / rapidly / swiftly
慢:slowly / gradually / steadily
大:greatly / vastly / considerably / substantially
小:slightly / marginally / minutely
数字副词:
about / around / roughly / more or less 12 million
(3)+(2a)增加/减少:名词
a sharp / slow / great / slight increase
an upward / rising / increasing tendency
a downward / falling / decreasing trend
(4)数字单位用单数
12 million而不是12 millions
(5)时间:
from … to … / between … and …
during the period from … to … / between … and … / starting from ….
(6)
show / prove / witness
(7)补充动词
keep / remain / maintain unchanged / constant / stable(保持不变)
fluctuate upward / downward(波动向上/向下)
double / triple / quadruple(2/3/4倍)
A possible answer: (Band 6.5)
According to the line chart, visits abroad by UK residents increased from about 12 to 57 million from 1979 to 1999. Similarly, overseas travelers to Britain went up from about 10 to 27 million. It is obvious that UK tourists were more and climbed faster than overseas ones during the period.
复杂线图:

复杂线图
极值:
峰值:peak (v. & n.), summit (v. & n.), highest point
谷值:touch the bottom (v.), nadir (n.), lowest point
稳定时期:plateau (n.高原), lower stationary phase (低稳时期)
A possible answer: (Band 6.5)
According to the curve chart, daily electricity need is higher in winter (38,000 units on average) than in summer (18,000 units on average). In winter, electricity consumption peaks at 2:00 am and 10:00 pm while it touches the bottom at 0:00 am and 8:00 am. On the other hand, in summer, it summits at 2:00 pm and 11:00 pm, but has a nadir at 9:00 am and a lower stationary phase from 4:00 pm to 9:00 pm.

简单柱图
简单柱图:
A possible answer: (Band 6.5)
The bar graph demonstrates that the most UK visitors went to France and Spain, which were 11.0 and 9.5 million. Also, many British travelers were attracted by the USA (4.0 million), Greece (3.5 million) and Turkey (2.0 million).

复杂柱图
复杂柱图:
比较:
90% of those who held a skilled vocational diploma were men, compared with only 10% of women.
More women held undergraduate diplomas (70%) and marginally more women reached degree level (55%).
Men with postgraduate diplomas clearly outnumbered their female counterparts (70% and 30% respectively).(摘自《剑桥雅思4》)
饼图:无非是两个表达的组合“占”和百分比。
饼图
“占”:
Occupy
Be shared by
Account for
Be responsible for
Be in charge of
Be in the charge of
百分比:
A small percentage of … (X%)
A quarter of …
The minority of … (X%)(小部分)
Half of …
The majority of … (X%)
Most of … (X%)
One-fifth of …
A possible answer: (Band 6.5)
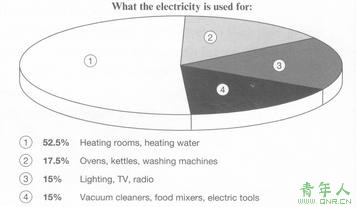
The pie graph demonstrates that heating rooms and water occupies the majority of electricity consumption (52.5%). Then, 17.5% of the electricity demand is shared by ovens, kettles and washing machines. Lighting, TV, radio and vacuum cleaners, food mixers, electric tools are responsible for the rest, with 15% each.

表格
表格:
数字引入:图表引用数字的三种主要方法
分词短语:
On average, 11% of all households, comprising almost two million people, were in this position.
括号:
Couples generally tended to be better off, with lower poverty levels for couples without children (7%) than those with children (12%).
介词短语:
However, those consisting of only one parent or a single adult had almost double this proportion of poor people, with 21% and 19% respectively.
词数填充Word filler :这些表达没有实际意义,考试的时候可以填充词数。
It is noticeable that …
It is easy to see that …
It is obvious that …
三、比较段comparison / 结论段conclusion:
比较段:内容无非是数据关联或者特征关联两种可能。
What is also worth mentioning is that … if the two diagrams are considered as a whole.
A possible answer: (Band 6.5)
What is also worth mentioning is that almost 40% UK tourists selected France and Spain in 1999, if the two diagrams are considered as a whole.
单图结论段:
Overall, the table/chart/graph/diagram suggests that …
A possible answer: (Band 6.5)
Overall, the table suggests that households of single adults and those with children were more likely to be living in poverty than those consisting of couples.(摘自《剑桥雅思4》)
(II)
流程图/示意图/地图
介绍段:
The flow chart / diagram / map illustrates … The whole procedure can be divided into … stages.
主体段:
一般过渡:时间、顺序、目的
时间:to begin with, next, then, later, finally; at the same time / simultaneously
顺序:the first stage involves … / in the second stage / in the third stage / in the last stage
目的:in order to / in order that; so as to / so that

图表作文
According to the diagram, the first step of obtaining water outdoors is to find a hole with green plants on the bottom. Next, remove the green plants on the middle of the bottom and put a container there. Then, cover the hole with a plastic sheet and place some stones on the edge of it to secure its position. Finally, a third stone is laid on the middle of the plastic sheet so that the middle part is also the lowest part.(摘自《雅思写作胜经》,群言出版社)
特殊过渡:状语从句when, where...
When the sun shines on the green plants in the hole, water evaporates from these plants. The vapor rises up and then cools down to form water drops under the plastic sheet. When there is more and more water, it flows along the sheet to accumulate under the lowest part. Finally, water falls down into the container directly under the middle stone.(摘自《雅思写作胜经》,群言出版社)
词语多样化:
accumulate / gather / collect / obtain
词语具体化:
水蒸气vapor和蒸发evaporate这样的词并不容易,考试的时候可以用具体的方式加以规避:
The water turns into gas, rises and finally turns into liquid again and gathers under the sheet of plastic.
句式:
客观描述,多用一般现在时和被动语态。
雅思A类小作文饼图解题思路
饼形图与柱形图或者是线形图所截然不同的是它没有了横轴与纵轴,而以饼形的分割来表示百分比,但我们仍可以依照三步的审题分析法来进行观察: Step 1: 观察共有几张饼图,以及它们之间的关系是什么(一般说来 ...
饼形图与柱形图或者是线形图所截然不同的是它没有了横轴与纵轴,而以饼形的分割来表示百分比,但我们仍可以依照三步的审题分析法来进行观察:
Step 1: 观察共有几张饼图,以及它们之间的关系是什么(一般说来,雅思图表题中极少见到单饼图);
Step 2: 观察每张饼图中有哪几个区域,以及各个区域分别代表什么;
Step 3: 观察单个饼图中各区域间的百分比差异,以及相同区域在各个饼图间的百分比的比较或发展。
现在我们就来分析一下下面的饼形图:
Many women want or need to continue working even after they have
children. The charts below show the working patterns of mothers with
young children to care for.
Write a report for a university lecturer describing the information on the
charts below.
Step 1: 一共有四张饼图,它们分别按照由母亲照料的最年幼孩子的年龄大小来进行排列,从0 ~ 2岁到10岁以上;
Step 2: 每张饼图中都有三种区域:白色区、深色区和浅色区。它们分别表示母亲的工作状态:白色区为“没有工作”,深色区为“兼职工作”,浅色区为“全职工作”;
Step 3: 白色区在0 ~ 2岁时处于绝对优势,占70%,而随着孩子年龄的增长,白色区渐渐地变小,在10岁以上时只有26%;深色区在孩子年幼时比例很小:0 ~ 2岁时只有19%。随着孩子的长大,深色区急剧扩张,在5 ~ 9岁时达到顶峰,占48%,但在10岁以后却轻微下降到45%;而浅色区的变化则是在同一时期内分别占到了11%,11%,14%和29%。
当然,在开始写文章之前,我们还必须决定文章所用的时态。在这张图的要求里,并没有说是过去的时间里做的调查,因此我们就默认为是一般现在时。
做完了审图的工作后,我们就可以着手开始选词了。在饼图中,表示百分比的句子是必不可少的。一般表示百分比有两种比较容易掌握的句型。我将用上图中第一张饼里的11%来举例。
a. The full time working mothers with 0 to 2 year old child to care for make up 11%.
b. The percentage of the full time working mothers with 0 to 2 year old child to care for makes up 11%.
大家可以明显看出这两句话的区别,即主语选用的对象不同。那么,如果所有的句子都这样写的话,是不是会造成很多的重复呢?这点考生不用担心,因为就象我们可以用“go up”来代替“increase”一样,表示占多少百 ...
大家可以明显看出这两句话的区别,即主语选用的对象不同。那么,如果所有的句子都这样写的话,是不是会造成很多的重复呢?这点考生不用担心,因为就象我们可以用“go up”来代替“increase”一样,表示占多少百分比也有一些动词词组来替换“make up”。比如说,“account for”和“constitute”,甚至可以用“be”动词。但是,有的培训老师会告诉学生,“occupy”也可以,因为它的意思是“占据”,但实际上在英文里,表示百分比是不可以用这个词的,这点大家要注意。除了谓语可以替换以外,“百分比”这个词本身也可以有同义词,比如说 “proportion”和“rate”,但是大家要注意,有的考生会用“ratio”(比率),甚至是“number”和“figure”来代替 “percentage”,这样一来表达就不确切了,是会失分的。
这幅图中还有一个难点,就是信息量大。一个百分比不仅跟妇女的工作模式相关,而且还要搭上需要照顾的小孩的年龄。一共12个百分比,发生重复是不可避免的。但是怎样才能使得文章比较不乏味呢?我们不妨来动动脑筋。刚才的11%的那群妇女我用的是分词作定语(full-time working),那么做定语的还有定语从句,那么我也可以用mothers who choose to work full time来代替,甚至是full-timers,或者是full-time employees 等等,都是可以用的。说到小孩的年龄,我们刚刚用的是with,那么表示伴随的非限制性定语从句也一定能奏效,也就是说,我们能这样来表示:
Those full-timers, whose child is 0 to 2 years old, account for 11%.
这样一来,句型就多变了。
另外我们不应该忽视一个有趣的现象,上次我们在柱形图的分析中曾经讲过,如果是按照时间顺序变化的柱形图,我们完全可以用表示上升,下降,不变,或者是最高点和最低点的词语,也就是线形图中的基本表达方法来表达。那么看这幅图,是不是也有着一样的特点?虽然是孩子的年龄而不是具体的年份,但是也是按照年份在走的图,因此我们完全可以用线形图的基本表达方法来表达。下面我用全职工作的妇女来举例。
As can be seen from the chart, those full-timers, whose child is 0 to 2 years old, account for 11%. The percentage remains unchanged when their baby grows two years older. However, mothers of 5 to 9 -year -old child witness a slight increase by 3% and the rate nearly doubles when their child reaches 10 -year -old. (58 words)
综上所述,这幅饼图中用到的是表示百分比和线形图的基本表达方法,这样写出来不会只是报流水账,而是使得饼图变化的趋势变得非常的明显和生动。当然不要忘记加上适当的路标词,也就是连词,使文章中的句子更加的平滑,通顺。
当然,不是每个饼图都是时间走势的。针对这样的图,我们只需要用上次介绍过的在柱形图中的“more than”或者“twice as much as”等的表示数据差异的短语加上百分比就可以了。
以上是对饼图解题主要思路和语言点的一点讲解,当然,要写好以上两幅图,我们还需要一个好的引言段,变化多端的句型,确切表达的词或者词组以及很好的衔接器件,这样才能写出一篇高分的小作文来。
完美解析雅思地图写作题
地图题分两种,一种为地理变迁题,一种为选址题。首先我们来看地理变迁题,它描述的是一个地方(多为一个城镇)在一段时间的发展变化。如20##年9月A 类 TASK 1, 剑1TEST 4。就这些图形,我们来总结地理变迁题的写作要点。
时态
如果地图题反映的是一个地方在过去的一段时间的变化,文章用一般过去时。如果地图题反映的是一个地方在将来一段时间的变化趋势,文章用一般将来时或表“估计”的词汇。如果地图题反映的是一个地方从过去到现在的变化,可用现完成时。
如:现在停车场改成了一个剧院。
The car park has been removed and replaced by a theatre.
城镇A的家庭数量从1937年到20##年将翻一番。
The number of homes in Town A is likely to double
(is likely to= is predicted to /is estimated to/is projected to/is expected to )
又可为:
It is likely that the number of homes in Town A will double.
(it is likely that = it is predicted/estimated/projected/ expected that…..)
细节变化
地图每个细节变化都要提到,不要忽视一个细节
语态
地图题用被动语态
如: 20##年在城镇A 新建了一个医院:A new hospital was established in Town A in 2000.
地图题的书写顺序:时间顺序和空间顺序
如20##年9月A 类TASK 1
The map shows the development of the village of Kelsbey between 1780 and 2000.
这篇文章大体框架按时间顺序,BODY 分三段分别描述:1780年村庄,1860村庄, 20##年村庄。对每一年的描述,如1780年村庄,我们要注意按方位顺序来描述,否则文章会出现混乱。这就需要考生在考前对方位词进行总结。地图题的方位我们说东西南北,不说成左右。
A 在B 的东方/西方/南方/北方
A is/ lies/ is located/ is situated in/on / to the east/west/south/north of B
(in 表A 在B 内部, ON 表A 和B接壤,TO 表A 和B 分开)
A 在B 内部的某个部位
A is in the eastern/ southern/ western/ northern part of B.
A在B 西北部的120 千米处
A lies 120 km to the northwest of B.
A 在B…..角落
A is at/in the south-eastern corner of B ( at 表示A 在B 外部, in表A 在B 内部)
在河流或道路的南边/北边等
On the south/southern side of the river
On both sides of the road
On the other side
临近马路的地区
The area adjacent to/ near /next to/ just off the road
在道路或河流的最南端
At the southern end of the river
A 在B 的对面
A is on the opposite side of B
A is opposite B
A 在B 东部的边界上(A 在B外部)
A is on the eastern border of B
A 在B 东部边缘上 (A 在B 内部)
A is on/ along the eastern edge of B
“变化”词汇
地图题描述的是一个地区的变化,那么“变化”词汇必须过关。
分析发现,变化包括两种:图形原有事物的改变,图形新添事物。
我们先看图形原有事物的改变:
原有事物可说成:
The original/previous/former garden
原有事物尺寸上变大/变小:
The size of the library has been enlarged/extended/halved/reduced by half
原有事物在数量上增多或减少:
The number of homes has increased/risen/grown/reduced /decreased/dropped/fallen/
doubled/ tripled/ quadrupled to 500.
原有事物没了:
The farms completely disappeared/were removed.
原有事物被改为:
A becomes B
A is transformed/reconstructed/redeveloped/converted/changed/turned over to/ into B
A is replaced /substituted by B = A gives way to B
图形新添事物
A newly-built road
A new car park was built/established/set up/constructed/completed and opened in the middle of B
A new IT centre has been added to the library
The year 20## saw two additions to the land: a pond in the northern part and a vegetable garden on the opposite side.
地图题第二类为选址题 如剑5 TEST 3 TASK 1
The map shows two possible sites for the supermarket. 为一个城镇的超市选址, 有两个位置 S1 和S2 供选择。选址题并不难写,主要注意两点:
位置描述
优缺点
这篇文章我们BODY段可分两段,分别陈述:
S1的位置及位置相应的优缺点
S2的位置及位置相应的优缺点
其中表位置的方位词已在前文有总结,
同理, 20## 年2 月A 类Task 1: The diagram below shows the problem of flooding in a UK town and two possible solutions
我们BODY 段可分两段,分别陈述:
Solution 1 的解决方案和相应的优缺点
Solution 2 的解决方案和相应的优缺点
其中,解决方案实际还是要涉及一些方位词。
雅思考试流程作文:你必须知道的东西
第一、要用好表示顺序的连接词(Sequencing Words)
既然是流程图,就不可避免的要说明过程的各个步骤和先后顺序,在这里,大家要注意几个词。例如,表示过程我们通常用“process”或“procedure”,过程的各个阶段和步骤我们可以用“stage”或“step”来描述。在谈到第一个步骤时我们可以用连接词“In the first place”、“To begin with”、“In the first stage”等引出。在进入中间的步骤时可以用“Then”、“Next”、“After this/that”等,最后一个步骤可以用“Finally”或“Lastly”。当然,如果有一些平行的步骤我们也可以用“At the same time”、“Meanwhile”等来引出。
以上这些词如果用的太频繁也会使文章显得较为单调,我们可以使用从句的方法使各个步骤的描写自然地衔接在一句话中。例如
When the cleaning is done, the bottles are conveyedto a glass factory where they are cut into glass pieces which are then poured into a furnace.
上面的句子用了when/where/which三个连词,就把玻璃瓶回收的三个步骤”cleaning- cutting –heating巧妙地连接在了一起。
第二、要学会使用被动语态
流程图写好的第二个关键是被动语态的使用。流程图表现的是客观的工作流程或事物发展的过程。因此,我们可以尽量避免用“We should/must/need to do sth.”的主动语态,改为“Sth. Should/must/needs to be done”这样的被动语态。被动语态和情态动词的恰当搭配,可以使文章显得更具有客观、和学术化色彩。
The production of cement starts in a mixer, where limestone gravel and sand are convertedinto a mixture, which is then fed into a crusher. Here the mixture is ground into cementpowder, and then is passed through a rotating heater.
上文中用到了convert、feed、grind、pass这四个动词的过去分词构造了被动语态,使过程的描写显得非常专业。
第三、引言段和结尾段的重要性
在流程图的引言段和结尾段写作中可以适当进行过程的阶段划分和总结,使文章的构思上一个层次,摆脱“流水账”的俗套。
This diagram illustratesthe recycling process of glass bottles. The whole process is a cycle which can be divided into three main stages.
In summary, plants, humans and animals provide services for each other. Humans and animals need the oxygen that plants produce in order to stay alive. When humans and animals breathe out, they provide the carbon dioxide that plants need in order to survive.
第四、要善于“绕开”专业的概念表达
在流程图中,有时不可避免的会出现一些比较专业的概念,考场上一时想不出对应的英文,这时候要善于利用已知的简单词汇,试着把这些“专业”的概念用简单的方式表达出来。例如,不知道如何表达“房间通风”(ventilation)这个概念,我们可以说“air moving through the house”来说明,不知道如何说“斧头”和“锯子”(axeand saw)我们就用“special tools”来绕过,虽然不是描述得很精确,但总比不写或写错了要好。
雅思名师各个击破-小作文逻辑分析
小作文是解说文性质的书面产出,不同于一般的记述,除了要把其中的数据表达出来,更重要的是要进行分析。如果小作文写成纯粹的数据罗列,也就是我们常说的一锅粥,是不可能得高分的。
常见的小作文的逻辑分析方法包括:总分、比较(类似比和相反比)、分类、因果、时空和过程分析等。
总分逻辑主要用于写pie chart 等,开始时要介绍一下总共有的项目数,其他图表中也可能会用到总体趋势分析,如线图中某一条线可能整体上升、下降或持平,但其中基本都会有某一个点是例外,常见的句型可以把总趋势作为主句,后面接独立主格或者with结构。
比较逻辑是大部分学生很会用的,无论是类似还是相反比较,只是要注意用稍微复杂点的句式。如表示两个项目很类似,大部分同学会把第一项用一个简单句写出来,然后第二个句子前面加上Like A, B also …。而要表示相对照,一般就会想到用but。除了句式的复杂,更要注意比较的每个句子尽量不要写成一样的形式,或者全部写成原始数据的积累,可以先找一个基准点,用一个句子把其中的数据写出来,第二个与之相比较的句子可以写比其稍高、多…%或者是几倍或几分之几。
对于图表中的数据较多,一般要用到分类,可以根据大体趋势如增多、减少、频繁变化或者几乎不变分成几个大类。几乎每个数据都罗列出来的文章也得不到高分,一般我们建议大家不要列出4项以上。其实每次考试中不论哪种图表几乎都至少有一个特殊点,这就和前面的总趋势加一个单点是一样的。
图表中有时候会有原因分析,这种情况下原因是一组要分析的数据,必须要写。但小作文忌讳把图中的信息粗略写完,加上大量的自己的主观评价,多数考生会根据自己的臆断写出原因分析,这样有悖于解说文的客观陈述的本意而成为议论文。根据考生回馈失分较重。
地图或流程图不同于一般的数据图表,可能更强调空间和时间的逻辑分析,所以写这两种图表时要尽量以空间的转移或者过程的衔接为线索。此外总分、比较等逻辑也应体现在其中。
总之,写作和口语其实都很注重逻辑分析,条理清楚的文章更为考官青睐。
-
雅思图表作文_A类雅思各类图表作文要点详解及范文
A类雅思各类图表作文要点详解及范文一曲线图解题关键1曲线图和柱状图都是动态图解题的切入点在于描述趋势2在第二段的开头部分对整个曲线…
-
雅思图表线性图写作范文
WRITINGTASK1Youshouldspendabout20minutesonthistaskThegraphbelowgivesinforma…
-
雅思写作-小作文范文-柱状图
柱状图C1T3题目Thechartbelowshowstheamountofmoneyperweekspentonfastfood…
-
雅思图表作文模板句
雅思图表作文模板句Para1Thisisatablechartline线状bar柱状pie饼状graphwhichdemonstr…
-
雅思写作小作文图表范文
最权威的国际教育服务平台雅思写作小作文图表范文很多同学在开始看到雅思考试的小作文的时候无从下手因为在我们国家的教育中对这方面的训练…
-
雅思写作-小作文范文-柱状图
柱状图C1T3题目Thechartbelowshowstheamountofmoneyperweekspentonfastfood…
-
雅思小作文范文
IELTS套句式写作大全第一部分TASK1图表写作套句精选1thetableshowsthechangesinthenumbero…
-
雅思写作-小作文范文-柱状图
柱状图C1T3题目Thechartbelowshowstheamountofmoneyperweekspentonfastfood…
-
雅思写作-小作文范文-表格
雅思小作文表格题写作技巧雅思小作文中表格题是经常出现的一种也是相对比较简单的一种那么雅思小作文表格题有哪些写作技巧呢下面为大家整理…
-
老外的标准雅思小作文范文(分享)
第三节观点之间的连贯Firstlyprimarilyinitially其他参考vThefirstandmostimportantt…
-
雅思小作文图表题的分析技巧
雅思小作文图表题的分析技巧柱状图:“比较”(找出similarity)和“对比”(找出difference),是写作的关键,既要横…