20xx-考研英语二作文模板、例文--非常全
图表作文(一)
第一节图表作文的类型
图表作文可分为两大类:表作文和图作文。
表作文
表格(Table)可以使大量数据系统化,便于阅读、比较。表格常由标题(Title)、表头(Boxhead)(表格的第一行)、侧目(Stub)(表格左边的第一列)和主体(Body)部分(表格的其余部分)等部分组成。如下表:
用表格表达的信息具体准确,而且表格中的各项均按一定规律排列。阅读表格时要注意找出表格中各个项目的相互关系,表格中各个项目的变化规律。例如,上面的表格中的数字说明,和1978年相比,1983年大学入学的人数在增加,而小学的入学人数在减少。搞清楚这些变化规律也就读懂了表格的内容。
图作文
图作文又可分为三种:圆形图作文、曲线图作文和条状图作文。
(1)圆形图作文
圆形图(Pie chart)也称为饼状图或圆面分割图。圆形图因为比较形象和直观,各部分空间大小差别容易分辨,所以常用来表示总量和各分量之间的百分比关系。整个圆表示总量,楔形块表示分量。有时圆形图还有数值表,两者结合可把各分量表示得更准确、清楚。例如:
This is a pie chart of the average weekly expenditure of a family in Great Britain.As can be see from the chart,the main expenditure of an average British family is spent on food,which accounts for 25%of its total expenditure.The next two significant expending items are transport and housing,which are 15%and 12%respectively.If we take into account clothing and footwear,which makes up 10%,the four essentials of life,that is,food,transport,housing,and clothing and footwear,amount to 62%of the total expenditure.
(2)曲线图作文
曲线图(Line graph)也称为线性图或坐标图。曲线图最适合表示两个变量之间关系的发展过程和趋势。一般来说,曲线所呈现的形状比某一点所代表的变量的值更有意义。曲线图有横轴和纵轴。一般先看横轴所代表的数量或时间等,然后再看纵轴所显示的意义。同时必须找出线条所反映的最高或最低的变化。例如:
这个曲线图的横轴代表1990年的不同的月份,纵轴代表交通事故的数量。从交通事故曲线图上可知,前八个月的交通事故的数量有升有降。曲线图在八月份升到了最高点(39),此后一直呈下降的趋势,十二月份降到了最低点(16)。可见,1990年的交通事故的数量总体上呈下降的趋势。
(3)条形图作文
条形图(Bar graph)也称为立柱图或圆柱图。条形图由宽度相同但长度不同的条块代表不同的量。当要比较几个项目或量时,常用不同颜色来区分。条形图主要用来表示:1)同一项目在不同时间的量;2)同一时间不同项目的量。阅读条形图时,要先看图例,再看横轴、纵横各代表什么量,每一个刻度所代表的值是多少,最后找出图中各长条所表示的数据及各长条间的相互关系。例如:
左边的条形图的横轴代表时间,纵轴代表期望寿命(Life Expectancy),这一条形图想要体现的是同一项目(期望寿命)在不同时间的量。右边的条形图的横轴也是代表时间,纵轴是代表婴儿的死亡率(Infant Mortality),这一条形图想要体现的也是同一项目(婴儿的死亡率)在不同时间的量。左边的条形图表明1990年的人均期望寿命比1960年的人均期望寿命长20岁,而1990年的婴儿死亡率比1960年的婴儿死亡率下降了50%。
第二节图表作文的出题形式
例1题目:Changes in People’s Diet
Study the following table carefully and your composition must be based on the information given in the table.Write three paragraphs to:
1.state the changes in people’s diet(饮食)in the past five years;
2.give possible reasons for the changes;
3.draw your own conclusions.
You should quote as few figures as possible.
例2题目:Car Accidents Declining in Walton City
Remember that your composition must be written according to the following outline;
1.Rise and fall of the rate of car accidents as indicated by the graph;
2.Possible reason(s)for the decline of car accidents in the city;
3.Your predictions of what will happen this year.
Your composition should be no less than 120 words and you should quote as few figures as possible.
例3 For this part,you are allowed 30 minutes to write a composition on the topic Health Gain in Developing Countries.Your composition must be no less than 120 words and you should base your composition on the following instructions(given in Chinese):
1.以下图为依据描述发展中国家的期望寿命(life expectancy)和婴儿死亡率(infant mortality)的变化情况
2.说明引起变化的各种原因
从以上例子可见,图表作文一般在题目中给出作文的标题和一个或几个统计表格、圆形图、曲线图或条形图,有时还用英文或中文提纲的形式给出提示,要求我们:
1)用文字描述图表,客观解释图表中所传递的信息,并找出某种规律或趋势;
2)就图表中所反映的某种趋势或问题分析其原因或后果。
第三节图表作文的写作要领
图表作文着重说明事实,常常是通过对图表中所反映的具体数据的说明、分析、比较,对某种事物或现象的事实或变化情况等加以说明,并提出结论或看法。因此,图表作文常常采用议论文体的写作方法。
写好图表作文,关键在于能否读懂图表中所提供的信息,把握各信息间的联系,用准确流畅的语言把这一信息表达出来,并就这一信息发表自己的看法。
图表作文的写作步骤
写图表作文时,要注意遵循以下步骤:
1)认真分析图表的含义,弄清图表中所含的信息及不同信息间的关系;
2)确定文章的主题思想,构思出文章的基本框架,筛选出能说明图表主题思想的典型数据;
3)编列文章的提纲;
4)根据文章的提纲,将各段的提纲内容扩展成段落,然后将各个段落组成文章,注意段与段之间的衔接与过渡;
5)检查与修改。
图表作文的篇章结构
写图表作文时,常采用三段式的谋篇方式。文章的第一段往往分析图表中的数据变化反映什么问题或趋势,概述图表所揭示的信息。第二段分析造成这一问题或趋势的原因。第三段则展望未来的情况或提出解决问题的办法或建议。这一结构可以简单地表述为:
第一段:概述图表反映的主题思想
第二段:分析产生的原因
第三段:展望未来或提出方法或建议
图表作文常用的句型
(1)常用的开篇句型(即概述图表内容时常用的表达法)
①According to the table/pie chart/line graph/bar graph,we can see/conclude that…根据该表/图,我们可知……
②The table/graph reveals(shows/indicates/illustrates/represents/points out)that…该表/图表明……
③As we can see from the table…
As can be seen from the line/bar graph…
As is shown(illustrated/indicated)in the pie chart…
如表/图所示,……
(2)描述增减变化常用的句型
①Compared with…is still increased by…
②The number of…grew/rose from…to…
③An increase is shown in…;then came a sharp increase of…
④In…the number remains the same/drops to…
⑤There was a very slight(small/slow/gradual)rise/increase in 1990.
⑥There was a very steady(marked/sharp/rapid/sudden/dramatic)drop(decrease/decline/fall/reduction)in 1998/compared with that of last year).
下面是根据例2的题目要求写的范文。
⑴From the graph,we can see that the number of car accidents in Walton city fluctuated during the year of 1990.⑵The first two months of 1990 showed an increasing trend.⑶The rate rose to 32 in March but fell to 26 in June.⑷From June on,the rate was rising again and reached the peak point 39 in August.⑸After August the rate began to decline remarkably,and eventually dropped to the lowest point 16 at the end of the year.⑹Therefore,it’s obvious that car accident in Walton city declined in 1990.⑴主题句/概述表格反映的内容⑵—(5)反映交通事故的变化情况(6)小结:总结表格数据反映的总趋势
⑺There are several reasons for the decline.⑻First,a new traffic law was made and came into force.⑼It provided that in summer every car must be air-conditioned.⑽As a result,the highest rate in August,when humidity and high temperature make drivers impatient and easily lead to car accidents,dropped steadily.⑾Second,new roads were built and some narrow streets were widened,which quickened the flow of traffic.⑿Finally,the city administration made great efforts to heighten people’s awareness of observing traffic rules.⑺主题句⑻原因/措施一⑼解释措施一/次要辅助⑽采取措施一后的结果⑾原因/措施二⑿原因/措施三
⒀With all these new measures,I’m sure the rate of car accidents in Walton city will go on falling this year.⒀总结:展望未来的情况
第四节、图表作文练习及其参考范文
下面是写作练习,在写作的过程中注意审题,考虑文章的结构、采用的扩展方法、开头的结尾的方法以及文章中的过渡等。
练习1:Directions:For this part,you are allowed thirty minutes to write a composition of no less than 120 words on Changes in People’s Diet.Study the following table carefully and your composition must be based on the information given in the table.Write three paragraphs to:
1.state the changes in people’s diet(饮食)in the past five years;
2.give possible reasons for the changes;
3.draw your own conclusions.
You should quote as few figures as possible.
⑴As is shown in the table,there have been great changes in people's diet between 1986 and 1990.⑵From the table,we can find that grain,formerly the main food of most Chinese people,is now playing a less important role in people's diet.⑶And the same goes for fruit and vegetables.⑷On the other hand,the consumption of high-nutrition food such milk and meat has increased rapidly.
⑸What has caused these changes?There are mainly three reasons(主题句).(6)First,people are much wealthier than before.(7)With higher income,they can afford to buy nutritious foods.(8)Second,people have realized the importance of a balanced diet to their health.(9)Lack of certain amount of meat or milk,for example,will result in poor health.(10)Finally,owing to the economic reform,meat and milk,which were scarce in the past,are produced in large quantities.
(11)Although milk and meat are important to one's health,eating too much rich food may result in obesity and may other diseases.(12)Therefore,people should not only eat a lot of milk and meat,but also enough grain,fruit and vegetable for the sake of their health.
图表作文(二)
一、图表作文写作常识
1、图形种类及概述法:
泛指一份数据图表:a data graph/chart/diagram/illustration/table
饼图:pie chart
直方图或柱形图:bar chart/histogram
趋势曲线图:line chart/curve diagram
表格图:table
流程图或过程图:flow chart/sequence diagram
程序图:processing/procedures diagram
2、常用的描述用法
The table/chart diagram/graph shows(that)
According to the table/chart diagram/graph
As(is)shown in the table/chart diagram/graph
As can be seen from the table/chart/diagram/graph/figures,
figures/statistics shows(that)……
It can be seen from the figures/statistics
We can see from the figures/statistics
It is clear from the figures/statistics
It is apparent from the figures/statistics
table/chart/diagram/graph figures(that)……
table/chart/diagram/graph shows/describes/illustrates how……
3、图表中的数据(Data)具体表达法
数据(Data)在某一个时间段固定不变:fixed in time
在一系列的时间段中转变:changes over time
持续变化的data在不同情况下:
增加:increase/raise/rise/go up……
减少:decrease/grow down/drop/fall……
波动:fluctuate/rebound/undulate/wave……
稳定:remain stable/stabilize/level off……
最常用的两种表达法:
动词+副词形式(Verb+Adverb form)
形容词+名词形式(Adjective+Noun form)
二、相关常用词组
1、主章开头
图表类型:table、chart、diagramgraph、column chart、pie graph
描述:show、describe、illustrate、can be seen from、clear、apparent、reveal、represent
内容:figure、statistic、number、percentage、proportion
2、表示数据变化的单词或者词组
rapid/rapidly迅速的,飞快的,险峻的
dramatic/dramatically戏剧性的,生动的
significant/significantly有意义的,重大的,重要的
sharp/sharply锐利的,明显的,急剧的
steep/steeply急剧升降的
steady/steadily稳固的,坚定不移的
gradual/gradually渐进的,逐渐的
slow/slowly缓慢的,不活跃的
slight/slightly轻微的、略微地
stable/stably稳定的
3、其它在描述中的常用到的词
significant changes图中一些较大变化
noticeable trend明显趋势
during the same period在同一时期
grow/grew增长
distribute分布,区别
unequally不相等地
in the case of adv.在……的情况下
in terms of/in respect of/regarding在……方面
in contrast相反,大不相同
government policy政府政策
market forces市场规率
measure n.尺寸,方法,措施v.估量,调节
forecast n.先见,预见v.预测
三、英语图表写作套句精选
1.the table shows the changes in the number of……over the period from……to……
该表格描述了在……年之……年间……数量的变化。
2.the bar chart illustrates that……该柱状图展示了……
3.the graph provides some interesting data regarding……
该图为我们提供了有关……有趣数据。
4.the diagram shows(that)……该图向我们展示了……
5.the pie graph depicts(that)……该圆形图揭示了……
6.this is a cure graph which describes the trend of……这个曲线图描述了……的趋势。
7.the figures/statistics show(that)……数据(字)表明……
8.the tree diagram reveals how……该树型图向我们揭示了如何……
9.the data/statistics show(that)……该数据(字)可以这样理解……
10.the data/statistics/figures lead us to the conclusion that……
这些数据资料令我们得出结论……
11.as is shown/demonstrated/exhibited in the diagram/graph/chart/table…如图所示…
12.according to the chart/figures……根据这些表(数字)……
13.as is shown in the table……如表格所示……
14.as can be seen from the diagram,great changes have taken place in……
从图中可以看出,……发生了巨大变化。
15.from the table/chart/diagram/figure,we can see clearly that……or it is clear/apparent from the chart that……从图表我们可以很清楚(明显)看到……
16.this is a graph which illustrates……这个图表向我们展示了……
17.this table shows the changing proportion of a&b from……to……
该表格描述了……年到……年间a与b的比例关系。
18.the graph,presented in a pie chart,shows the general trend in……
该图以圆形图形式描述了……总的趋势。
19.this is a column chart showing……这是个柱型图,描述了……
20.as can be seen from the graph,the two curves show the fluctuation of……
如图所示,两条曲线描述了……的波动情况。
21.over the period from…to…the…remained level.在…至…期间,…基本不变。
22.in the year between……and……在……年到……期间……
23.in the 3 years spanning from 1995 through 1998……1995年至1998三年里……
24.from then on/from this time onwards……从那时起……
25.the number of……remained steady/stable from(month/year)to(month/year)。
……月(年)至……月(年)……的数量基本不变。
26.the number sharply went up to……数字急剧上升至……
27.the percentage of…stayed the same between…and……至…期间…的比率维持不变。
28.the figures peaked at……in(month/year)……的数目在……月(年)达到顶点,为……
29.the percentage remained steady at……比率维持在……
30.the percentage of…is slightly larger/smaller than that of比例比…的比例略高(低)。
31.there is not a great deal of difference between……and………与……的区别不大。
32.the graphs show a threefold increase in the number of…… 该图表表明……的数目增长了三倍。
33……decreased year by year while……increased steadily. ……逐年减少,而……逐步上升。
34.the situation reached a peak(a high point at)of[%]. ……的情况(局势)到达顶(高)点,为……百分点。
35.the figures/situation bottomed out in…… 数字(情况)在……达到底部。
36.the figures reached the bottom/a low point/hit a trough. 数字(情况)达到底部(低谷)。
37.a is……times as much/many as b .a是b的……倍。
38.a increased by…… a增长了……
39.a increased to…… a增长到……
40.high/low/great/small/percentage. 比低高(低)
41.there is an upward trend in the number of………… 数字呈上升趋势。
42.a considerable increase/decrease occurred from……to……… 到……发生急剧上升。
43.from……to……the rate of decrease slow down. 从……到……,下降速率减慢。
44.from this year on,there was a gradual declinel reduction in the……,reaching a figure of……从这年起,……逐渐下降至……
45.be similar to…… 与……相似
46.be the same as…… 与……相同
47.there are a lot similarities/differences between……and…… ……与……之间有许多相似(不同)之处
48.a has something in common with b a于b有共同之处。
49.the difference between a and b lies in…… a与b之间的差别在于……
50……(year)witnessed/saw a sharp rise in…… ……年……急剧上升
开头段转述题目常用句型
The line graph describes/illustrates/demonstrates/summarizes/outlines/shows…
后面跟名词或者从句
开头段或者主体段引出数据或者趋势常用句型
According to/As shown in/As can be seen from…后面跟图表的类型
It can be seen from…后面跟图表的类型…that
It is manifest from…后面跟图表的类型…that
表示上升的动词
Go up(went up)/rise(rose)/grow(grew)/increase(increased)/ascend(ascended),其中
rise和increase也经常作名词,grow-growth
表示急剧上升的动词
Jump(jumped)/surge(surged)/shoot up(shot up)/soar(soared)其中surge也可以做名词
表示下降的动词
Decline/fall/drop/sink/dip/decrease/descend,其中decline/fall/drop/decrease也经常做名词
表示急剧下降的动词
Plummet/plunge
表示速度快的形容词
Sharp/dramatic/drastic/rapid/precipitous/steep副词加-ly
表示幅度大的形容词
Marked/substantial/significant,副词加-ly
表示缓慢,逐渐的形容词
Gradual/steady/gentle/slow,副词加-ly
表示小幅度的形容词
Modest/moderate/slight,副词加-ly
表示波动的动词
Fluctuate,不及物动词,名词fluctuation
表示稳定在一个水平上的动词
Level off at/level out at/hover at/stabilize at/reached a plateau at
表示达到最高的动词
Peak at/reach the highest point at,peak也可以做名词
表示达到最低的动词
Reach the bottom at/the lowest point at/bottom out at,bottom也可以做名词
表示经历了某种变化的及物动词
Experience/witness/see
表示达到了多少数量的及物动词或词组
Reach/arrive at/amount to/hit/register/stand at
表示占…(后面跟百分数或数字)的及物动词或词组
Account for/represent/constitute/make up
表示数据由某几个部分组成的既无动词或者词组
A is composed of/comprise/is made up of/consists of B,C and D.注意和include区别
表示对未来数字的预测的及物动词
Project/predict/forecast
表示"分别"的副词
Respectively—in the 20## Olympics,China and Russia won X and Y gold medals
respectively.
表示"大约"的副词或者词组
About,around,approximately,roughly,just over,just under
图表作文(三)
作文1
DIRECTIONS:A.Study the following graphs carefully and write an essay in at least 150 words.B.Your essay must be written clearly on the ANSWER SHEET II.C.Your essay should cover these three points:
1.effect of the country’s growing human population on its wildlife
2.possible reason for the effect
3.your suggestion for wildlife protection

【段落类型分析】
第一段第二段第三段
图画/图表描述段原因阐释段建议措施段
【参考范文一】
From these graphs,we can draw a conclusion that,with the growth of human population,the number of species has decreased rapidly in America,and some species have even vanished from our planet.
There are numerous reasons accounting for the phenomenon and I would like to explore a few of the most important ones here.Above all,as the human population grows rapidly,a growing number of people came to live where some wild species have been living.Then these species have to move to other places.Some of them probably can not adapt to the new environment and die.In addition,although many people look on the wildlife as their friends,some people may not think so.They catch a lot of wild animals and sell them in order to get more money.Consequently,the natural balance and the ecologic environment are destroyed.The clear cutting has become increasingly serious.So some of the wildlife become homeless and extinct.
In order to protect the wildlife,I have some suggestions.First,the governments should make laws to prevent them from being caught and killed.Second,the governments should educate people to love nature and protect it.Third,as for ourselves,we should take practical actions to protect our living environment.(210 words)
【参考范文二】
The two charts show that the increase in the U.S.population has been accompanied by a corresponding decline in the number of wildlife species.Far too many species have been lost already.This poses a danger to the ecological balance.
As the human population expands,wild animals in mounting numbers are hunted for food,or because they are thought to present a threat to man.But studies show that one of the primary causes of the disappearance of wildlife is pollution,which is one of the consequences of population growth and economic development.This makes us wonder if men are able to share this planet in harmony with other life forms.
In my opinion,it is imperative for us to take steps to reverse the disturbing trend illustrated in the charts.One measure would be to forbid the building of cities in areas where wild life is threatened with extinction.But,more importantly,men must learn to stop polluting the environment,or he himself will be extinct.(167 words)
【参考范文三】
As is seen from the two graphs,it is clear that with the rapid growth of U.S.population from 1800 to 1990,the number of its wildlife species no longer existing soared during the same period.Naturally,we can draw the conclusion that the sharp decline of wildlife species resulted from the population growth.
Several reasons may account for this phenomenon.To begin with,as the population grows,people consume much more natural resources.Second,with the increase of human activities,modern people take up more and more space which exerts a great influence on other species.Finally,the problem of pollution becomes more and more serious with the development of modern industry.More and more animals have to adapt themselves to the decaying environment or move to a totally different place,but not all of them are fortunate enough to survive the changes.
Solving this problem calls for,above all,the government’s efforts to control population growth,to decrease industrial pollution and to enhance the laws to forbid wildlife hunting.Moreover,common citizens should be aware of this ecological crisis and take on the responsibility of wildlife protection.In a word,only when the government and the common people make joint efforts can we hope to find a satisfactory solution to this problem.(216 words)
作文2
图略
The line graph illustrates how the number of people using a London underground station fluctuates over the course of 16 hours(6am to 10pm).
As we can see from the graph,at 6am the number of people at the station stands at only 100.The number shoots up over the next two hours,peaking at 400 at 8am.Then the number descends drastically for two hours,bottoming out at 180 at 10am.The period between 10o'clock and 12o'clock witnesses a moderate growth in the number of people in the station,with the number reaching 280 at midday.Numbers in the following two hours stabilize at just under 300 people.Then the number plummets to only 100 from 2pm to 4pm.Then the next two hours see a dramatic rise again,with 6pm registering 380 people.After 6pm,the number dips again,reaching the lowest point of 130 at 8pm.The period from 8pm to 10pm experiences a slight rise,but then the number of people declines again from 180 at 9pm to 135 at 10pm.
This line graph clearly demonstrates that rush hours in the early morning and the early evening are periods when the station is used by the most people.
作文3
The diagram illustrates in four stages the recovery of the forests in Yellowstone National Park after a devastating forest fire.
In the first picture,while the old forests still exist,they drop bad wood to the soil under them,which renders the soil more fertile.Then lightning and fire strike,destroying the forests completely.And the growth of new forests starts right at this point.The second picture demonstrates that in the first 50 years after the devastating fire,saplings grow in build while descend in overall number.In the next two centuries,the young trees continue to thrive in Yellowstone,because of the fertile soil and the ample sunlight.Then,three hundred years after the fire,the number of trees decline to roughly the same as the old forests.
These five pictures show us that it takes as long as three centuries for a destroyed forest to fully recover.Further,they vividly explain to us the natural law of"survival of the fittest".The number of trees that a region can support is not limitless,which means the forests on earth will not be an inexhaustible resource.
作文4
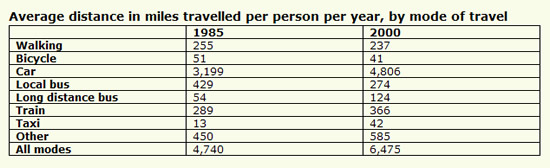
The table below gives information about changes in modes of travel in England between 1985 and 2000.Summarise the information by selecting and reporting the main features,and make comparisons where relevant.
范文1
The table indicates the number of miles by the average English person in 1985 and 2000,using various means of transport.
The number of miles walked,cycled and travelled by local bus all decreased.Of these,the number of miles travelled by local bus decreased the most,from 429 miles in 1985 to 274 miles in 2000.
The number of miles travelled by car,long distance bus,train and taxi all increased.
The number of miles driven by car was 3,199 in 1985 and rose by 50%to 4,806 in 2000.The number of miles travelled by long distance bus more than doubled from 54 miles(1985)to 124 miles(2000).The number of miles driven by taxi trebled from 13 miles(1985)to 42 miles(2000).The use of other,unspecified,forms of transport also increased.
Overall,the number of miles travelled by the average English person rose from 4,740 miles in 1985 to 6,475 miles in 2000,with the increase of cars accounting for almost all of that increase.(173 words)
范文2
The table demonstrates how different modes of travel changed in England in 15 years spanning from 1985 to 2000.In general,the modes are classified into two kinds in terms of average miles travelled per person per year:one enjoyed rising popularity while the other decreasing.
The travel modes which gained popularity in the period included cars,long distance buses,trains,taxis and others.Cars remained top among the modes in the 15 years,with its average miles increasing considerably from 3,199 in 1985 to 4,806 in 2000.Long distance buses and taxis seemed to be warmly welcomed by travelers,so average miles travelled in the two modes almost tripled.
Travels by walking,bicycles and local buses lost travelers’favor in the one and a half decade.Average travelling distance by local buses suffered the biggest decrease,dropping from 429 to 274,whilst the number of miles by walking and bikes fell mildly from 255 to 237 and from 51 to 41 respectively.Despite the decreases,however,the total miles travelled grew from 4,740 to 6,475.
In brief,the total travelling distance in the country grew in 15 years when cars,long distance buses,trains,taxis and other modes of travel were more popular and walking,bicycling and local transportation less popular.(212 words)
作文5
Directions:For this part,you are allowed 30 minutes to write a composition of no less than 100 words on Income Sources between Chinese and American Students.Study the following table carefully and your composition must be based on the in formation given in the table.Write three paragraphs to:
1.Describe the differences of the income sources between Chinese and American students.
2.Analyze possible reasons for these differences.
3.Predicate future tendency.
Source of income Percentage of Total Income
______________________________________________________________________________
Parents Part-time job Fellowship or Scholarship
American students 50%35%15%
Chinese students 90%5%5%
_______________________________________________________________________________
范文:Income Sources Between Chinese Students and American Students
Income sources of Chinese students are quite different from those of American students.In China,students get 90%of their money from their parents while in America,only 50%of students`money is provided by parents.In addition,Chinese students earn only 5%of their money from part time jobs and 5%from fellowship or scholarship while income from these two resources for American students takes up 35%and 15%respectively of their total income.
I think there are probably three reasons for their differences.First,because of the influence of different social and family values,Chinese students have formed the habit of asking for money from their parents while American students have developed more sense of being financially independent.Second,most Chinese parents devote too much care to their children and they would rather save up to afford their children’s education rather than encourage them to take part-time jobs.But in America,many parents pay more attention to developing the studentsability of self-reliance,so they encourage their children to find part-time job to earn some money by themselves.Third,since America is more developed than China,it is relatively easy for students to find part-time jobs.In China,such opportunities are rather rare.
I believe with the development of China,more and more Chinese students will realize and pay more attention to the necessity of self-dependence.In addition,more and more opportunities will be provided for them to take part-time jobs.So more students will go out of the ivory tower to broaden their knowledge and to become the master of their own lives.
作文6
For this part,you are allowed thirty minutes to write a composition on the topic:Student Use of Computers.You should write at least 120 words,and base your composition on the chart and the outline given below:
1.上图所示为1990年、1995年、20##年某大学生使用计算机的情况,请描述其变化;
2.请说明发生这些变化的原因(可从计算机的用途、价格或社会发展等方面加以说明);
3.你认为目前大学生在计算机使用中有什么困难或问题。
范文:Student Use of Computer
Since 1990,there has been tremendous growth in the use of computers by students.While in 1990,the average number of hours a student spent on the computer was about one hour per week,this number grew to nearly four hours per week by 1995,and to approximately 20 hours per week by the year 2000.
This significant growth in the use of computers by students in the 1990’s can be attributed to several factors,including widespread usage,lower prices,and technological and social developments.Nowadays,computers are widely used by students for word processing,book keeping,multimedia presentations,and access to the Internet for both research and communications.Additionally,since 1990,due to competition and technological advances,computer hardware and software prices,as well as Internet usage charges have dropped significantly.Finally,technological developments and changes in social habits in the 1990’s have played a major role in this tremendous growth in the use of computers.Today’s society relies heavily on computers for immediate access to the news and for entertainment,including,listening to music,watching movies and sport events,and playing computer games.
While computers are of great assistance to the students,and therefore,are indispensable tools,they also pose some challenges.The biggest challenge that many students face is discipline in the use of this powerful device.That is,students need to have the discipline of not allowing themselves to be lured by the entertaining aspects of this wonderful tool—aspects that can result in addiction to computer games or viewing of undesirable material on the Internet.That is to say,students need to use this powerful tool with great wisdom!
作文7
The graphs below show the age structure of a European country from 1901 to 1981 and a prediction for 2021.Summarize the information by selecting and reporting the main features,and make comparisons where relevant.You should write at least 150 words.
Sample Answer
The graphs compare the population makeup of one European country every forty years from 1901 to 1981,and the estimated number in 2021.
There was a huge increase in the number of people in this country from 38,225,000 in 1901 to 67,180,000 eighty years later,and this upward trend is expected to last through to the year 2021,when the population is estimated at 87,658,000,more than double the 1901 figure.
In 1901 and 1941,the population structure in this country was completely the same,with an overwhelming majority of its population(95%)below 65,4%between 65 and 85 and only 1%over 85 years old.
However,the year 1981 saw a sharp increase in the percentage of the elderly.Altogether,they made up 17%of the total population,whereas the projection for the year 20## shows that they will continue to grow but less dramatically to 20%of the total population(15%for 65-85-year-olds and 5%for over-85-year-olds).
In summary,changes are taking place not only in the number of people but also in the ages of the people who make up the population in this European country,indicating it is advancing into an aging society.
中间段
1.The most obvious reason for this phenomenon is that______________.Consequently,______________.
2.No matter you like it or not,AAA has become more and more popular and there are many reason for it.
3.It’s an urgent task for us to change this unfavorable situation:______________.
4.The picture can reminds you of some strange,yet familiar phenomena existing in our society.
5.A great number of solutions are being offered.Some people suggest that______________.Others argue that______________.
6.Confronted with AAA,we should take a serious of effective measures to cope with the situation.
7.However,________may cause some problems.First,it is__________.Second,_______.Finally,_____.So,it is clear that______________has its advantages and disadvantages.
8.Although______________has a great advantage of______________,it can’t compete with______________in______________.
9._________may be preferable to______________,but______________suffers from the disadvantages that________.
10.The advantages of______________are much greater that those of______________.For instance,______________.
11._______may be preferable to______________,but it also suffers from the disadvantages that______________.
12.But I don’t think it is a very good way to solve_______.For instance,______________.Worst of all,____.
13.There are many ways to______________.First,______________.Second,______________.Third,______________.
14.On the contrary,there are some people in favor of_______.They believe_________.Moreover,they think_______.
15.There are several measures for us to adopt.First,we can______________,there are a number of advantages of______________.Another solution is to______________.
16.It is high time that something was done about it.For example,______________.In addition,______________.All these measures will certainly______________.
17.There are some other people,who______________.Their reasons are different,something for______________,sometimes for______________,and sometimes simply for______________.
18.______________is necessary and important to our country’s development and construction.First,______________.What’s more,______________.Most important of all,______________.
19.However,if not managed properly,______________can create many problems.Sometimes______________.Furthermore,______________.Therefore,______________has been gaining public concern.
20.There are probably many reasons for______________.First,______________.Second,______________.Finally,______________.
21.Well,why is there________?I think there might be two reasons.One is_______,and the other is______________.
22.There are,I think,two main reasons for______.In the first place,_______.In the second place,________.Therefore,_____.
23.Why______________?For one thing,_________.For another,________.Perhaps the main reason is______________.
24.It is no easy job to find the reasons for this tendency which involves several complicated factors.For some______________.For others______________.
25.Why______________?The first reason is that______________.The second reason is______________.The third is______________.For all this,the main cause of______________is due to______________.
26.It is reasonable to maintain that______________,but it would be foolish to persist that______________.There are three reasons______________.
27.The explanation for this problem involves many factors.For one thins,______________.For another,______________.Still______________.
28.The causes for______are varied.They include______________.Perhaps the main cause is______________.
29.The eventual result it brings out is______________.And perhaps the most obvious result of______________is______________.
30.However,just like everything has both its good and bad sides,______________also has its own disadvantages,such as,______________.besides,______________.
31.__ _will bring the society many benefits.For one thing,______________.For another thing,______________.
32.Why________?Some_________.And the most common case is that______.The notable example is to______________.
33.There are many reasons responsible for this instance,and the following are the typical ones.For one thing,______________,in addition,______________.The main reason is that______________.
34.People had figured out many ways to solve this problem.Firstly______________.Though this method has its good sides like it can______________.One of its bad sides it brings about is that it can______________.
35.Some reasons can explain the trend.First,______________.Second,______________.Third,______________.
36.One of the reasons that is given for______________is that______________.
37.A further reason why I advocate an attitude of______________is that______________.
38.What is more,the essence of_____is that___________,although we cannot,most of us______________.
39.Nonetheless,I reckon that______________is more advantageous.
40.From a personal perspective,I also prefer to______________because______________.
41.To make a moral point,I feel that______________is important for______________is that______________.
42.The main reason why I feel that______________is important for______________is that______________.
43.______________is superior in several ways,of which perhaps the most fundamental is that______________.
44.There are numerous reasons why______,and I shall here explore only a few of the most important ones.
45.One very strong argument for______________is that______________.
46.Moving on to wider themes,many people would argue that______________is important for______________because______________.
47.Of course,I am aware that both ways have potential pitfalls.
48.The advantages of______________carry more weight that those of______________.
49.I can think of better illustration of this idea than the example of______________.
50.Perhaps the most important example of______________is______________.
51.I fully agree with the statement that______________.The reasons are chiefly as follows.
52.I fully agree with the statement that______________because______________.
53.As far as I am concerned,my favor goes to______________.The followings are the reasons of my choices.Firstly______________,secondly,______________.
54.Of these two ways of______________,I inclined to this point of view which______________.First of all,______________,secondly,______________.
55.But there are still many people who don’t agree.They argue that______________.
56.However,the advantages far outweigh the disadvantages.The idea is easily supported by foots that______________.
57.For all the disadvantages,______________has its compensating advantages.Firstly______________,secondly,______________.
结尾句
1.The most effective means to solve this problem is that______________.In that case,______________.
2.Everything has its own two sides,no exception with AAA.For one thing,______.for another,_________.
3.My experience tells me that to______________needs a thorough and persevering process,and in this process you had better abide by the principles mentioned above.
4.On the whole,it is high time that we recognized the significance of______________.
5.As a result,we should take some effective methods to______________.
6.Judging by the figures,we can draw a conclusion that______________.
7.In a word,the whole society should pay close attention to the problem of_______.Only in this way can______________in the future.
8.In my opinion,we should place much emphasis on the importance of______________.
9.But______________and______________have their own advantages.For example,______________,while______________.Comparing those two,however,I prefer to______________.
10.In my opinion,______________is just as common as______________.If______________,it may be very useful.Whatever______________,the key point lies in______________.
11.Are their opinions correct?To my mind,the first idea seems______.As for the second idea,________.
12.As a popular saying goes,______________.In my opinion what really counts is not______________,but______________.I believer that as long as______________,we will______________.So I am for the opinion that______________.
13.In my opinion,both sides are partly right.When we______________,we should take into consideration all aspects of the problems,and then make the right decision.
14.Personally,I believer that_______.Consequently,I’m confident that a bright future is awaiting us because_______.
15.In my opinion,all of the people should be brave enough to show our disapproval and criticism when confronted with______________.
16.People are coming to realize the importance of______________.They have begun to try their best to______________.We believe that______________.
17.All in all,we cannot live without______________.But at the same time we must try to find out new ways to cope with problems that would arise.18.Whatever you do,please remember the saying-______________.If you understand it and apply it to your study or work,you’ll definitely benefit a lot from it.
19.With the development of society,______________.So it’s urgent and necessary to______________.If every member is willing to contribute himself to the society,it will be better and better.
20.It is difficult to say whether______________is good or not in general as it depends very much on the situation of______________.However,from a personal point of view I find______________.
21.It is essential that effective actions should be taken to end the situation.
22.It is no doubt that special attention must be paid to the problem of______________.
23.But both______________and______________have disadvantages.For example,______________.Which to choose,______________or______________?Careful consideration is necessary before you make your own choice.
24.From what has been discussed above,we may reasonably arrive at the conclusion that______________.
25.We must search for a quick action,because the present situation of______________is grievous,if allowed to proceed,will certainly lead to______________.
26.No doubt,if we ignore the problem,there is every chance that______________will be put in danger.
27.We need to take a second look at the matter from a wider standpoint,otherwise,we won’t______________.
28.It is high time that______________.Here are some of the measures that might be taken immediately.
29.In conclusion,we should know about the problem of_____,and object to______.Only in this way________.
30.Although it is affected by many factors,still there are certain ways that can make the situation better.The most import is______________.Another way is______________.Still another one is______________.
31.Many solutions are offered here,all of them make some sense,but none is adequate enough.The problem should be studied in depth.
32.No easy method can be at hand to solve the problem of______________.But the common recognition of the importance of______________might be the first step on the right way.
33.It is clear,therefore,that the task of______________demands great attention.
34.We may have a long way to go before we reach the final goal.But once we are on the way,the chance to reach it is greater.
35.But for me,I would rather think of the matter in an optimistic way.Because I believe______________.
36.We all know the story of______________.this lesson tells us that______________,we should______________.
37.My own point of view is that______________is a normal behavior in our society.There is no doubt that______________.As an old saying goes,______________.
38.If we can’t take useful means,we may not control this trend,and some undesirable result may come out unexpectedly,so what we should do is______________.
39.However,this graph may not predict the entire situation in the future.I believe______________.
40.From the graph it is evident that______________.
41.From all the reasons above,we know that great changes had taken place in_______.And I believe that______.
42.Taking into account all of these factors,we may reach the conclusion that______________.
43.For the reasons given above,I strongly recommend that______________.
44.Given the factors I have just outlined,I believe that______________.
45.Therefore,it is not difficult to draw the conclusion that______________.
46.Recognizing the fact that______________should lead us to conclude that______________.
47.In short,I support the statement that it is better to______________because______________.
48.After pondering this question on many occasions,I have finally reached the conclusion that______________is something I truly want to do and it is worthwhile.
49.My point of view in______________largely results from the fact that______________.
50.Now after close examination,it is not difficult to draw the conclusion that______________.
51.From what has been discussed above,you can get your preference.Personally,I think______has more advantages.
52.On the one hand,it has helped china______________.On the other hand,it has increased china’s______________,and at the same time,made great contributions to our national development.
53.In my opinion,to solve this problem there might be two ways.One way to tackle this question is______________.Another way that is worth adopting is______________.
54.As far as I am concerned,I trust the advantages mentioned above exceed the disadvantages.
55.For me,______________is a glory and it is the most important thing I have to take into feasible consideration.
56.As regards me,I tend to pick______________,for______________.What’s more,______________.
57.If I were given a choice between______________and______________,I would certainly prefer______________.
作文模版(七)
图表作文
Directions:
1) Describe the changes indicated in the table.
2) The reasons for the change.
3) Make predictions about the future tendency.
Statistics in People’s Daily Expenses in Xi’an
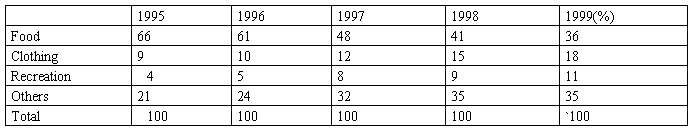
What is shown in the table above indicates that dramatic changes have taken place in the daily expenses in Xi’an from 1995 to 1999.The expenses on food have declined by 30%while those on clothing and recreation have increased respectively by 9%and 7%.The statistics of rise and fall seem to exist in isolation but closely related to each other.
There are two factors accounting for these changes.Development in economy is an essential one in the five years.The increased income resulting from economic growth plays a vital role in the less expense on food.Hence,a small percentage of total income is enough to cover food expenses.Another one is the changes in life style.When food presents no worry to the average,people begin to focus more of their interest on handsome appearance and happy leisure time.As a result of such a shift,spending on clothing and recreation increases year by year.
From the analyses made above,we may come to the conclusion that people’s living standards in Xi’an have been constantly improved between 1995 and 1999.With the further growth in economy and more changes in life style,the tendency indicated in the table will continue in the better direction.(206 words)
考研英语小作文书信类八大模板
1:投诉信
Dear_______,
I am ______ (自我介绍) .I feel bad to trouble you but I am afraid that I have to make a complaint about_____.
The reason for my dissatisfaction is _______(总体介绍). In the first place,_______(抱怨的第一个方面). In addition, ___________(抱怨的第二个方面). Under these circumstances, I find it ____ (感觉)_______(抱怨的方面给你带来的后果).
I appreciate it very much if you could _______(提出建议和请求), preferably ______(进一步的要求),and I would like to have this matter settled by ____(设定解决事情最后期限).
Thank you for your consideration and I will be looking forward to your reply.
Yours sincerely
Li Ming
2:询问信
Dear ______,
I am ____________ (自我介绍). I am writing to see if it is possible for you to provide me with information regarding_______.(要询问的内容)
First of all, what are ____________________?(第一个问题) Secondly, when will___________________?(第二个问题) Thirdly, is __________?(第三个问题)
I would also like to inquire ________(将最重要的问题单独成段). Could you be so kind as to send me some relevant booklets on the above-mentioned aspects?
Thank you for you kindness, and your prompt attention to this letter will be highly appreciated.
Yours sincerely
Li Ming
3:请求信
Dear___________,
I am writing to formally request to___________(请求的内容)
The reason for_____is that______(给出原因).I_____, so I_____(给出细节)
I would also like to request______(提出进一步的要求). I am sorry for any inconvenience I have caused.
Thank you for your attention to these requests. If you have any questions, do not hesitate to contact me at _______(电话号码).I look forward to a favorable reply.
Yours sincerely
Li Ming
4:道歉信
Dear ___________,
I am truly sorry that_________________________(道歉的原因).
The reason is that_(介绍原因) Once again, I am sorry for any inconvenience caused. Hope you can accept my apologies and understand my situation.
Yours sincerely
Li Ming
5:感谢信
Dear______,
I am writing to extend my sincere gratitude for _________ (感谢的原因). If it had not been for your assistance in ___________ (对方给你的具体帮助), I fear that I would have been_________(没有对方帮助时的后果).
Every one agrees that it was you who______________(给出细节).Again, I would like to express my warm thanks to you! Please accept my gratitude.
Yours sincerely
Li Ming
6:建议信
Dear ___________,
You have asked me for my advice with regard to _______, and I will try to make some conductive suggestions here.
In my humble opinion, you would be wise to take the following actions: ____(建议的内容)
I hope you will find these proposals useful, and I would be ready to discuss this matter with you to further details.
Good Luck with your_______(祝愿)
Yours sincerely
Li Ming
7:求职信
Dear Sir or Madam,
I write this letter to apply for the position that you have advertised in______(报纸名称)of______(广告发布时间).
Not only do I have the qualifications for this job, but I also have the right personality for a_____(工作名称). In the one hand,______(第一个原因). On the other hand, _______(另一个原因).
Should you grant me a personal interview, I would be most grateful. If you need to know more about me, please feel free to contact me at any time at _______________(电话号码)
Thank you for considering my application, and I am looking forward to meeting you.
Yours sincerely
Li Ming
8:邀请信
Dear________,
There will a ____(内容) at/in_____ (地点) on___ (时间). We would be honored to have you there with us.
The occasion will start at ___________(具体时间). This will be followed by a _______(进一步的安排). At around______(时间),_______________(另一个安排)
I really hope you can make it. RSVP before ___________(通知你的最后期限)
Yours sincerely
-
20xx年考研英语一作文范文
20xx年考研英语一作文范文一应用文小作文DirectionsYouaresupposedtowriteforthepostgra…
-
20xx年考研英语小作文及范文作文一
20xx年考研英语小作文及范文作文一一以研究生会的名义写一封通知通知的内容是为全球一体化的国际会议招募志愿者这个通知必须包括申请者…
-
20xx考研英语作文
20xx考研英语作文txt54就让昨日成流水就让往事随风飞今日的杯中别再盛着昨日的残痕唯有珍惜现在才能收获明天SectionIII…
-
20xx年考研英语作文议论文写作范文
20xx年考研英语作文议论文写作范文UNIT九大主题词汇一计算机通讯类1计算机commitcomputercrimes进行电脑犯罪…
-
20xx年考研英语作文点评及参考范文
年年岁岁题相似岁岁年年人不同这句话最好诠释了近10年考研英语大作文的特点20xx年1月9日下午的英语考试刚刚落下帷幕广大考研学子还…
-
20xx考研英语作文写作常用词汇、词组、短语、句型汇总
京盛博文教育考研英语作文万能模板大作文只需写一句话就考18分20xx考研英语作文写作常用词汇词组短语句型汇总考研在即这段时间对于所…
-
20xx考研英语二作文模板整理(大作文和小作文)
20xx年考研英语作文模板短文写作十种经典段落框架一图画图表描述段示例一Fromthepicturegraphcharttable…
-
考研英语作文范文八篇
一网恋DirectionsWriteanessayentitledOnlineLoveAffairyouressayshouldm…
-
20xx年考研英语作文范文大全
20xx年考研英语作文真题范文大全20xx年全国研究生考试英语科目已结束作文地带第一时间对考研英语一及英语二大小作文真题进行了整理…
-
考研英语二作文模板、例文--非常全
图表作文一第一节图表作文的类型图表作文可分为两大类表作文和图作文表作文表格Table可以使大量数据系统化便于阅读比较表格常由标题T…
-
20xx年考研英语二作文命题规律分析
各位网友大家好,非常高兴又见面了。我是文都教育的王泉,那么今天利用这样一个机会,跟大家分享一下20xx年x月x日考研[微博]英语二…