高考英语图表作文模板[1]
英语图表作文模板推荐
The chart gives us an overall picture of the ____________(图表主题)。The first thing we notice is that_______________(图表最大特点)。This means that as __________, _________________(进一步说明)。
We can see from the statistics given that _______________(图表细节一)。After ving_________(细节一中的第一个变化), the _____Ved+幅度+时间(紧跟着的变化)。The figures also tells us that_________________________(图表细节二)。(数据位置,如In the second column), we can see that ____________accounts for _______(进一步描述)。
Judging from these figures, we can draw the conclusion that___________(结论)。The reason for this, as far as I am concerned is that_____________(给出原因)。/It is high time that we Ved(发出倡议)
英语四六级作文模板大全(二) 图表式作文模板
It is obvious in the graphic/table that the rate/number/amount of Y has undergone dramatic changes. It has gone up/grown/fallen/dropped considerably in recent years (as X varies). At the point of X1, Y reaches its peak value of …(多少). What is the reason for this change? Mainly there are … (多少)reasons behind the situation reflected in the graphic/table. First of all, …(第一个原因). More importantly, …(第二个原因). Most important of all, …(第三个原因). From the above discussions, we have enough reason to predict what will happen in the near future. The trend described in the graphic/table will continue for quite a long time (if necessary measures are not taken括号里的使用于那些不太好的变化趋势).
图表作文写作常识
1、图形种类及概述法:
泛指一份数据图表:a data graph/chart/diagram/illustration/table
饼图:pie chart
直方图或柱形图:bar chart / histogram
趋势曲线图:line chart / curve diagram
表格图:table
流程图或过程图:flow chart / sequence diagram
程序图:processing/procedures diagram
2、常用的描述用法
The table/chart diagram/graph shows (that)
According to the table/chart diagram/graph
As (is) shown in the table/chart diagram/graph
As can be seen from the table/chart/diagram/graph/figures,
figures/statistics shows (that)...
It can be seen from the figures/statistics
We can see from the figures/statistics
It is clear from the figures/statistics
It is apparent from the figures/statistics
table/chart/diagram/graph figures (that) ...
table/chart/diagram/graph shows/describes/illustrates how......
3、图表中的数据(Data)具体表达法
数据(Data)在某一个时间段固定不变:fixed in time
在一系列的时间段中转变:changes over time
持续变化的data在不同情况下:
增加:increase / raise / rise / go up ...
减少:decrease / grow down / drop / fall ...
波动:fluctuate / rebound / undulate / wave ...
稳定:remain stable / stabilize / level off ...
最常用的两种表达法:
动词 + 副词形式(Verb+Adverb form)
形容词 + 名词形式(Adjective+Noun form)
相关常用词组
1、主章开头
图表类型:table、chart、diagramgraph、column chart、pie graph
描述:show、describe、illustrate、can be seen from、clear、apparent、reveal、represent
内容:figure、statistic、number、percentage、proportion
2、表示数据变化的单词或者词组
rapid/rapidly 迅速的,飞快的,险峻的
dramatic/dramatically 戏剧性的,生动的
significant/significantly 有意义的,重大的,重要的
sharp/sharply 锐利的,明显的,急剧的
steep/steeply 急剧升降的
steady/steadily 稳固的,坚定不移的
gradual/gradually 渐进的,逐渐的
slow/slowly 缓慢的,不活跃的
slight/slightly轻微的、略微地
stable/stably 稳定的
3、其它在描述中的常用到的词
significant changes 图中一些较大变化
noticeable trend 明显趋势
during the same period 在同一时期
grow/grew 增长
distribute 分布,区别
unequally 不相等地
in the case of adv. 在...的情况下
in terms of / in respect of / regarding 在...方面
in contrast 相反,大不相同
government policy 政府政策
market forces 市场规率
measure n. 尺寸,方法,措施 v.估量,调节
forecast n. 先见,预见 v. 预测
英语图表写作套句精选
1.the table shows the changes in the number of……over the period from……to……
该表格描述了在……年之……年间……数量的变化。
2.the bar chart illustrates that……该柱状图展示了……
3.the graph provides some interesting data regarding……该图为我们提供了有关……有趣数据。
4.the diagram shows (that)……该图向我们展示了……
5.the pie graph depicts (that)……该圆形图揭示了……
6.this is a cure graph which describes the trend of……这个曲线图描述了……的趋势。
7.the figures/statistics show (that)……数据(字)表明……
8.the tree diagram reveals how……该树型图向我们揭示了如何……
9.the data/statistics show (that)……该数据(字)可以这样理解……
10.the data/statistics/figures lead us to the conclusion that……这些数据资料令我们得出结论……
11.as is shown/demonstrated/exhibited in the diagram/graph/chart/table……如图所示……
12.according to the chart/figures……根据这些表(数字)……
13.as is shown in the table……如表格所示……
14.as can be seen from the diagram,great changes have taken place in……
从图中可以看出,……发生了巨大变化。
15.from the table/chart/diagram/figure,we can see clearly that……or it is clear/apparent from the chart that……从图表我们可以很清楚(明显)看到……
16.this is a graph which illustrates……这个图表向我们展示了……
17.this table shows the changing proportion of a & b from……to……该表格描述了……年到……年间a与b的比例关系。
18.the graph,presented in a pie chart, shows the general trend in……
该图以圆形图形式描述了……总的趋势。
19.this is a column chart showing……这是个柱型图,描述了……
20.as can be seen from the graph,the two curves show the flutuation of……
如图所示,两条曲线描述了……的波动情况。
21.over the period from……to……the……remained level.在……至……期间,……基本不变。
22.in the year between……and……在……年到……期间……
23.in the 3 years spanning from 1995 through 1998……1995年至1998三年里……
24.from then on/from this time onwards……从那时起……
25.the number of……remained steady/stable from (month/year) to (month/year)。
……月(年)至……月(年)……的数量基本不变。
26.the number sharply went up to……数字急剧上升至……
27.the percentage of……stayed the same between……and……
……至……期间……的比率维持不变。
28.the figures peaked at……in(month/year)……的数目在……月(年)达到顶点,为……
29.the percentage remained steady at……比率维持在……
30.the percentage of……is sightly larger/smaller than that of……
……的比例比……的比例略高(低)。
31.there is not a great deal of difference between……and…………与……的区别不大。
32.the graphs show a threefold increase in the number of……
该图表表明……的数目增长了三倍。
33……decreased year by year while……increased steadily.……逐年减少,而……逐步上升。
34.the situation reached a peak(a high point at) of[%].
……的情况(局势)到达顶(高)点,为……百分点。
35.the figures/situation bottomed out in……数字(情况)在……达到底部。
36.the figures reached the bottom/a low point/hit a trough.数字(情况)达到底部(低谷)。
37.a is ……times as much/many as b.a是b的……倍。
38.a increased by……a增长了……
39.a increased to……a增长到……
40.high/low/great/small/ percentage.比低高(低)
41.there is an upward trend in the number of…………数字呈上升趋势。
42.a considerable increase/decrease occurred from……to…………到……发生急剧上升。
43.from……to……the rate of decrease slow down.从……到……,下降速率减慢。
44.from this year on,there was a gradual declinel reduction in the……,reaching a figure of……
从这年起,……逐渐下降至……
45.be similar to……与……相似
46.be the same as……与……相同
47.there are a lot similarities/differences between……and……
……与……之间有许多相似(不同)之处
48.a has something in common with b a于b有共同之处。
49.the difference between a and b lies in…… a与b之间的差别在于……
50……(year)witnessed/saw a sharp rise in…… ……年……急剧上升
图表作文
图表作文至少包含描述图表与解释原因两个部分,而当前的图表作文大多还有第三个
段落。图表作文的规律性很强,不像图画式作文那样富于变化。
1.首段的写作
图表作文有表格(table)、柱形图(bar chart)、饼状图(pie chart)和折线图(diagram)之分,后三种都是属于图表的范畴(chart)。不管是chart还是table,都需要进行描述,一般放在文章的第一部分,长度宜适中。描述数据我们要首先看看是几个变量(A),每个变量有几个数据(B),不妨以A*B表示。
如果只有一个变量,有三个数据,可以描述如下:
From the chart we can see clearly that the average number of hours a student spends on Internet per week has increased from less than two hours in 1998 to nearly four hours in 2000, and then to 20 hours in 2004.
如果是最常见的是2*3的情形,可以描述如下:
From the chart, we can see clearly that in a big city in China, state owned houses declined from 75% in 1990 to 60% in 1995 and then to 20% in 2000, while private houses rose from 25% to 40% and then to 80% during the same period.
这里用了while引起从句来突显对比,是一种非常好的办法,如果用两句话来描述,也完全可以。
如果是1*n(n>3)的情形,将头与尾描述出来即可,比较好的方法就是在句中描述最后一个与第一个相比变化了多少。
碰到多变量、每个变量多数据的情形,大家应首先进行分类,分成上升、下降两类,或者上升、下降、不变三类,这样问题就迎刃而解了。
2. 第二段的写作
第二段是解释原因的段落。我们谈谈两个问题。
首先是过渡句这个问题。这里不大可能放在第一段,因为第一段不可能象有的命题作文那样简洁(如只有一句)——例如提纲式作文中的批驳类文章中除二段首句批驳之外还有首段末句批驳,效果很强烈。
其次就是此段的主题句(topic sentence)的问题。此句或主观或客观并无拘束,只要上下文风格统一即可。
主观:We believe that three reasons can account for this phenomenon.
I believe that three reasons can account for this phenomenon.
In my mind, the reasons why the overseas students are on the rise are as follows.
主观之变体(使用插入语,突显主语):Three reasons, we believe, can account for this phenomenon.
Three reasons, I believe, can account for this phenomenon.
Three reasons, I firmly believe, can account for this phenomenon.
注意:插入语的使用属于看似平淡却极富功力的技巧,可以达到很好的效果。
主观之变体(使用插入语):Three reasons, in my mind, can account for this phenomenon.
客观:Several reasons can account for this phenomenon.
在主题句之后,可以使用连接词分两个、三个或四个方面来写,其中分三个方面来写最为常见。这里就与普通的说明文与议论文一样了——可以由最重要的到最不重要的,也可以由最不重要的到最重要的,也可能平行分布,依具体情况而定,不一而足。
3. 第三段的写作
第三段直接写结论的情况已基本没有了。如果这篇文章讲的是一个令人担忧的问题,那么这一段写解决办法的可能性最大。
如果这篇文章讲的是一个好的变化,那么这一段很可能是两种情况——可能写负面的影响或存在的问题,或者写未来趋势或发展方向。
咱们看看很象利弊类的情况,如一篇文章的第三段:
上述情况均是依提纲而定,提纲中如果没有第三点,那么一般说来,若是问题则写办法,若是好事则写展望,根据具体情况而定。
图表作文范文
请根据下表用英语写一篇短文,介绍某地区5年来人们的饮食变化情况。
内容要点:
1. 饮食变化的情况。
2. 说明人们饮食方面发生变化的原因。
3. 变化说明了什么及所带来的好处。
(注意:少用百分比)
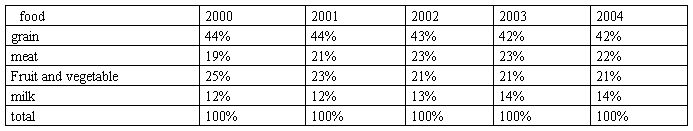
It is obvious in the table that the diet habit of the people in some area underwent dramatic changes from 20## – 2004. The amount of grain they ate fell year by year, and at the same time they increased their consumption of milk and meat. Besides, the consumption of fruit and vegetables fell from 25% to 21%.
There are two reasons for the changes. For one thing, with the increasing living standard, people are better off and can afford more expensive food of better nutrition. For another, more and more people begin to pay attention to the quality of their diet, because hey believe a balanced diet does good to their health. These changes in people’s diet shows that their living conditions improved greatly between 20## and 2004. We are sure that they are living a happier and healthier life.
From the above discussions, we have enough reason to predict what will happen in the near future. The trend described in the table will continue for quite a long time, I think.
图表常用经典句子:
开头:
1. As can be seen from the chart/graph/table...
2. It can be seen from the statistics that...
3. As revealed/shown/stated/noted in the picture...
4. The chart gives information that...
描述:
1. There was a rise/increase/upward trend from...to...
2. It has risen to an average of...
3. There was a fall/decrease/reduction/decline/drop/downward trend from...to...
4. It has fallen/dropped/declined to...
结论:
1. From the analyses above,we can draw the conclusion that...
2. From the data we gatherde from the above graph,we can conclude that...
3. According to the information gathered above,we may reach the conclusion that...
4. According to what has been discussed above,we can arrive at the
conclusion that...
5. The graph reflects that...
用于引言段的句子:
1. when asked about...the majority of people say...
2. nowadays,more and more people are beginning to realize the importance of...
3. with the development of...great changes have taken place in...
4. there is a general discussion about...
5. many people often ask this question...
6. there is no doubt that...
7. it is well-known/generally/said/argued/held that...
8. some people argue/claim that...
用于扩展段的句子
1. there are several reasons for...but in general,they come down to
three major ones
2. it can be easily proved that...
3. none can deny that...
4. there are many factors that may account for...but the following are
the most typical ones
5. many ways can contribute to solving this problem,but the following
ones may be most effective
6. generally speaking,the advantages can be listed as follows
7. in many cases,however,there are something beyond our expectation,yet
we can compare and contrast all the relevant factors and find a way out in between
8. we can take it for granted that...
提出与前面相反的观点:
1. As a popular saying goes,"A coin has two sides."
2. But as most other things,it has its own problems.
3. However,it is not without shortcomings.
4. But things are changing from place to place/from time to time/from person to person,and nothing should be taken in isolation.
5. Besides,we can’t neglect the fact that...
6. In spite of the advantages, it also has its own disadvantages.
7. Different people have different views on...
8. When it comes to...
9. Despite their similarities,A and B are also differen.
10. The most striking difference is that A...,while B...
提出自己的观点:
1. Contrary to the popular thought,I prefer...
2. As far as I am concerned...
3. while it is generally believed that...I argue that...
4. From my point of view...
5. In my opinion...
6. My view on it is as follows.
7. To tell you the truth...
用于结尾段的句子:
1. From/According to what has been discussed/analysed above,we can
draw/reach/come to/arrive at the conclusion that...
2. In a word/In brief/In conclusion...
3. It might be the time that some attention should be paid to...
4. Taking into account all these factors,we may safely arrive at the
conclusion that...
5. It is high time that we put an end to the tendency of...
6. We must look for a immediate method/measure,if the current tendency
is allowed to continue/proceed,it will surely/ certainly lead to/result in the
heavy cost of...
7. No effective solution can be at hand to deal with the problem of...but
the commmon/general recognition of the importacnce of...might be the first step
towards...
8. There is no easy method to the problem of...,but...might be helpful.
9. There is no doubt that special attention must be paid to the problem of...
10. It is necessary that effective action should be taken to prevent the situation.
11. It remains to be seen whether...but the prospect is not encouraging.
12. To reverse the trend is not an easy job,and it requires a keen consciousness of...
-
0Xmmko20xx考研英语作文模板大全大总结大预测
生活需要游戏,但不能游戏人生;生活需要歌舞,但不需醉生梦死;生活需要艺术,但不能投机取巧;生活需要勇气,但不能鲁莽蛮干;生活需要重…
-
四级英语作文模板
描述图表段模板Asisshowninthechart,theaveragehoursastudentspendsusingcomp…
-
英语作文模板
一,现象解释型模板(括号内为备选模板句型)1.__________hasbecomeacommonpartofpeople’sli…
-
20xx高考英语作文模板汇总
对比观点题型(1)要求论述两个对立的观点并给出自己的看法。1.有一些人认为。。。2.另一些人认为。。。3.我的看法。。。Theto…
-
Cosrwer20xx考研英语作文模板大全大总结大预测
秋风清,秋月明,落叶聚还散,寒鸦栖复惊。20xx考研英语作文模板:情感类20xx考研英语作文模板大全:论证观点之情感类这种类型的文…
-
Egcfmqy英语图表作文
生命是永恒不断的创造,因为在它内部蕴含着过剩的精力,它不断流溢,越出时间和空间的界限,它不停地追求,以形形色色的自我表现的形式表现…
-
考研英语写作大作文范文及模板:图画作文
图画作文1写作攻略图画作文是较难的题型之一近几年考研英语写作试题均为图画题型因此考生应该特别认真地对待这类题一般要求考生仔细看图根…
-
20xx年12月英语六级作文范文:图画作文
题目DirectionsForthispartyouareallowed30minutestowriteanessaybasedo…
-
看图作文--高中英语议论文写作
看图作文高中英语议论文写作观察下面的图画根据图画的内容写一篇短文说明你和你的爸爸对暑假的不同看法1短文必须包括图画的主要内容可以适…
-
英语四级图表+图画作文讲解及参考范文
英语四级图表和图画作文讲解及参考范文图表作文也是四六级考试中常见而且被认为是一种较难的作文形式图表作文就是把非文字信息通常为各种图…