雅思小作文各类图表写法汇总
雅思小作文各类图表写法汇总
1、line graph
线图要注意分段。尤其是多条线,如果放在一起描述,很容易混乱。所以建议还是分开来描述,主要原则是仅看描述就能画出图线。一般而言,是按时间,除了结合时间还要看走势上的分段,大段的描述不可缺;另外就是最高点和最低点,以及拐点的数字以及时点描述。只有具备了这两点,才能画出图线的走势。对于不同线之间的比较,可以在最后一段进行,利用交点进行分段。
2、Bar chart
柱状图,同样的,要注意分组。尤其是多国家、多年分之间的比较,建议考生根据最大的特点分成两组(最多三组),然后分组(一组一段)进行叙述。此类图中,可以少用数据,可以动态的方式进行描述,同时可以利用排名来叙述特点。描述完特点后,如果图表较为简单,最后一段可以把每项的最高、最低点写一下。如果类别少(2个),还是分别进行描述比较清晰。
无论了line graph 还是bar chart 尽量以单项从头至尾的描述为首选(这样清晰明了),中间穿插一两次对比,或者最后对比。(但这种描述方式只适合于比较的项目少的情况,即只是两者之间的比较。类
别一旦多,如果是可以归为两类的情况,则也可以采用这种描述方式,否则不适用)
3、Table
表格也可以分为动态描述和静态描述。动态:即为紧跟一个国家,从头到尾描述完所有特点,然后再描述另外的国家。静态是:每个特点就每个国家分别描述。无论以上两种采用哪一个,都应当注意分组,尤其是在国家和特点过多的情况下,分组描述,可以减少字数。对于明显的两类,建议采用动态描述法,因为它们在每一项特点下都具有相似的规律,这样比较明晰。
两个图表的写作:一般分为两段,分别进行描述。如果其中一个图特别简单,可以用最后一段简单描述,如果两个图表差不多复杂就采用1:1的比例,分别对各自特点进行描述,然后在最后一段将两者进行联系和比较。雅思写作
4、Pie
饼图建议不要按一个一个饼来描述,而是根据饼中的信息进行分组描述,同样的注意动态描述和最值,这里不多加赘述了。
5、Process Diagram
流程图,考生要看懂图,这是关键,图中的所有文字、图与图之间的变化和不同都要识别。在写的时候可以将图中的名词转为动词使用,建议按图中分好阶段进行描写,多使用被动语态。
第二篇:雅思图表作文 A类小作文 范文
You should spend about 20 minutes on this task.
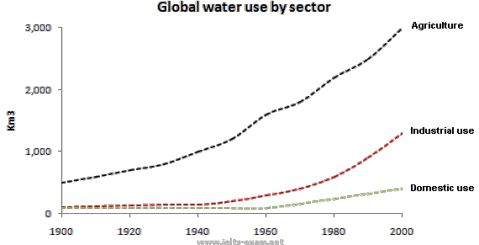
The graph and table below give information about water use worldwide and water consumption in two different countries.
Summarise the information by selecting and reporting the main features, and make comparisons where relevant.
Write at least 150 words

model answer:
The graph shows how the amount of water used worldwide changed between 1900 and 2000.
Throughout the century, the largest quantity of water was used for agricultural Purposes, and this increased dramatically from about 500 km3 to around 3,000 km3 in the year 2000. Water used in the industrial and domestic sectors also increased, but consumption was minimal until mid-century. From 1950 onwards, industrial use grew steadily to just over 1,000 km3, while domestic use rose more slowly to only 300 km3, both far below the levels
of consumption by agriculture.
The table illustrates the differences in agriculture consumption in some areas of the world by contrasting the amount of irrigated land in Brazil (26,500 km3) with that in the D.R.C. (100 km2). This means that a huge amount of water is used in agriculture in Brazil, and this is reflected in the figures for water consumption per person: 359 m3 compared with only 8 m3 in the Congo. With a population of 176 million, the figures for Brazil indicate how high agriculture water consumption can be in some countries.
(180 words)
You should spend about 20 minutes on this task.
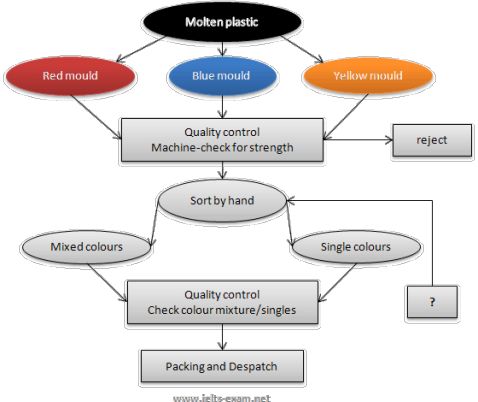
The flowchart illustrates the production of coloured plastic paper clips in a small factory.
Write a report for a university tutor describing the production process.
Write at least 150 words.

model answer:
There are four main stages in the production of plastic paper clips from this small factory. Two of these stages involve actual preparation of the clips, while the other two consist of quality control before the clips are sent out from the factory to the retailers to be sold to the public.
To begin with, molten plastic is poured into three different moulds depending on the colour required; the colours are red, blue and yellow. Once these clips emerge from the moulds a quality control machine checks them for strength. Unsatisfactory clips are rejected. In the third stage in the process the clips are stored by hand into two groups, mixed and single colours. When this stage is complete the groups are checked a second time to ensure that the colour mixtures are divided correctly into single colours and mixed colour batches. Finally, the clips are packed and dispatched to the markets.
(152 words)
You should spend about 20 minutes on this task.
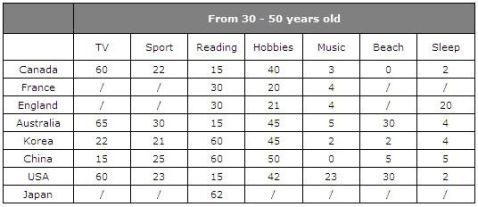
The table below give information about Favorite Pastimes in different countries.
Summarise the information by selecting and reporting the main features, and
make comparisons where relevant.

Write at least 150 words.
model answer:
This table clearly presents and compares favorable pastimes in eight different countries. The pastimes, across the top of the table, are analyzed in relation to each country.
As can be seen, about 60% of Canadians, Australians and Americans like watching television. On the other hand, this figure is quite low for China where only 15% of people watch television. Predictably, Americans like music at 23%, whereas only 2 to 5% of people in the other countries feel the same way. 20% of people in England enjoy sleeping as a pastime whereas in Canada and the USA, for example, the figure is only 2%. Interestingly, the Chinese like hobbies the most at 50%, as opposed to only 20% in France. It isn’t surprising that the highest percentage of beach-lovers is in Australia and the USA at 30%.
It seems that pastimes of people of different nationalities may be influenced by a number of factors such as the socio-economic situation or the climate. These factors influence cultural differences between different nationalities and make cross-cultural experiences more interesting.
(175 words)
You should spend about 20 minutes on this task.
Write a report for a university lecturer describing the information shown below.

You should write at least 150 words.
model answer:
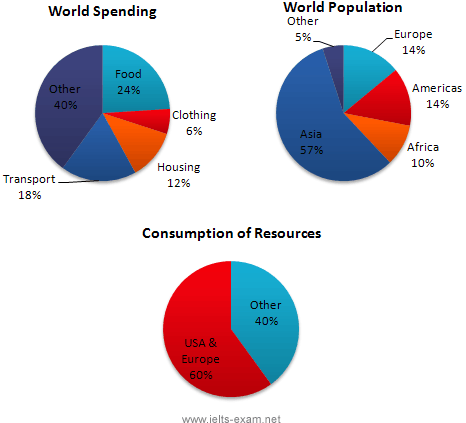
In this analysis we will examine three pie charts. The first one is headed ‘World Spending.’ The second is ‘World Population’ and the third is ‘Consumption of Resources.’
In the first chart we can see that people spend most of their income (24%) on food. In
some countries this percentage would obviously be much higher. Transport and then housing are the next major expenses at 18% and 12% respectively. Only 6% of income is spent on clothing.
In the second chart entitled ‘World Population’, it is not surprising to find that 57% of people live in Asia. In fact China and India are two of the most populated countries in the world and they are both situated on this continent. Europe and the Americans account for nearly 30% of the total, whilst 10% of people live in Africa.
Finally, the third chart reveals that the USA and Europe consume a huge 60% of the world’s resource.
To sum up, the major expenditure is on food, the population figures are the highest for Asia and the major consumers are the USA and Europe.
(182 words)
-
雅思写作-小作文范文-柱状图
柱状图C1T3题目Thechartbelowshowstheamountofmoneyperweekspentonfastfood…
-
雅思小作文范文
IELTS套句式写作大全第一部分TASK1图表写作套句精选1thetableshowsthechangesinthenumbero…
-
雅思小作文技巧及范文
雅思小作文写作技巧及范文一图表类型饼状图直方图或柱形图趋势曲线图表格图流程图或过程图程序图二解题技巧A表格图1横向比较介绍横向各个…
-
雅思小作文组合图范文和写作思路
今天环球雅思为正在备考雅思写作的考生介绍雅思小作文组合图范文和写作思路我们先从雅思小作文组合图范文开始雅思小作文组合图一Write…
-
雅思小作文写作模板
雅思小作文曲线图写作步骤先根据横轴分析变化然后再进行比较第一段介绍核心信息eg时间地点研究对象一句话即可第二三段先分析第一个时间点…
-
雅思写作图表小作文最容易出现的五大误区
No1分析图表背后的原因这是中国学生的习惯性毛病写作文时候总喜欢写上为什么雅思小作文是客观性写作只要求通过图表描述和总结不能写上为…
-
雅思写作-小作文范文-柱状图
柱状图C1T3题目Thechartbelowshowstheamountofmoneyperweekspentonfastfood…
-
雅思写作-小作文范文-柱状图
柱状图C1T3题目Thechartbelowshowstheamountofmoneyperweekspentonfastfood…
-
雅思写作小作文线形图表题(附范文)
雅思写作LINEGRAPHWRITINGTASK1Test2CambridgeIELTS7Youshouldspendabout2…
-
雅思写作小作文图表范文
最权威的国际教育服务平台雅思写作小作文图表范文很多同学在开始看到雅思考试的小作文的时候无从下手因为在我们国家的教育中对这方面的训练…
-
雅思小作文范文
IELTS套句式写作大全第一部分TASK1图表写作套句精选1thetableshowsthechangesinthenumbero…