oracle awr检查报告
oracle awr检查报告
1. 报告采集说明
Awr报告可以总体反映oracle数据库的信息和运行情况,帮助快速定位数据库问题。 建议生成业务高峰时段报告,如:8:00 -17:00
2. 生成awr报告方式:
在服务器上以sysdba用户登录数据库
sqlplus / as sysdba
运行以下脚本
SQL>@?/rdbms\admin\awrrpt
Current Instance
~~~~~~~~~~~~~~~~
DB Id DB Name Inst Num Instance
----------- ------------ -------- ------------
1265912605 ORCL 1 orcl
Specify the Report Type
~~~~~~~~~~~~~~~~~~~~~~~
Would you like an HTML report, or a plain text report?
Enter 'html' for an HTML report, or 'text' for plain text Defaults to 'html'
Enter value for report_type: --回车,选择默认生成html格式
Type Specified: html
Instances in this Workload Repository schema
~~~~~~~~~~~~~~~~~~~~~~~~~~~~~~~~~~~~~~~~~~~~
DB Id Inst Num DB Name Instance Host
------------ -------- ------------ ------------ ------------
* 1265912605 1 ORCL orcl IBMT60
Using 1265912605 for database Id
Using 1 for instance number
Specify the number of days of snapshots to choose from
~~~~~~~~~~~~~~~~~~~~~~~~~~~~~~~~~~~~~~~~~~~~~~~~~~~~~~ Entering the number of days (n) will result in the most recent
(n) days of snapshots being listed. Pressing <return> without
specifying a number lists all completed snapshots.
Enter value for num_days:1 --输入要查看几天的快照,我们选一天 Snap Instance DB Name Snap Id Snap Started Level ------------ ------------ --------- ------------------ -----
orcl ORCL 293 10 May 2011 9:01 1 294 10 May 2011 10:00 1 295 11 May 2011 11:00 1 Specify the Begin and End Snapshot Ids
~~~~~~~~~~~~~~~~~~~~~~~~~~~~~~~~~~~~~~
Enter value for begin_snap:
Specify the Begin and End Snapshot Ids ~~~~~~~~~~~~~~~~~~~~~~~~~~~~~~~~~~~~~~
Enter value for begin_snap: 294 --报告开始时间对应的快照编号 Begin Snapshot Id specified: 294
Enter value for end_snap: 295
End Snapshot Id specified: 295 --报告结束时间对应的快照编号
Specify the Report Name
~~~~~~~~~~~~~~~~~~~~~~~
The default report file name is awrrpt_1_294_295.html. To use this name, press <return> to continue, otherwise enter an alternative.
Enter value for report_name: 回车,使用默认的报告名称,或者自己起个名字 Using the report name awrrpt_1_294_295.html
3. 查看报告
当前目录下找到报告,下载到windows系统,用浏览器打开查看。
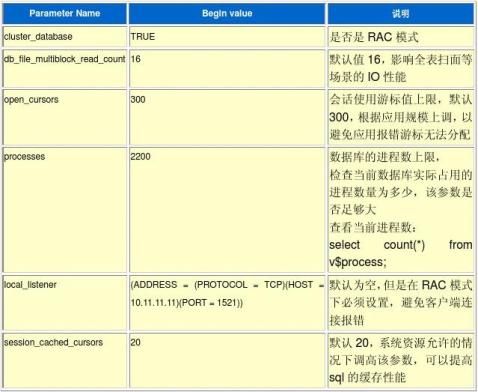
? 参数检查
找到init.ora Parameters部分,检查数据库参数设置。Oracle数据库参数设置没有固定的标准,根据硬件和应用环境的不同,不同设置带来的效果也不同。但是每个参数有其影响的方面。 部分参数说明如下:

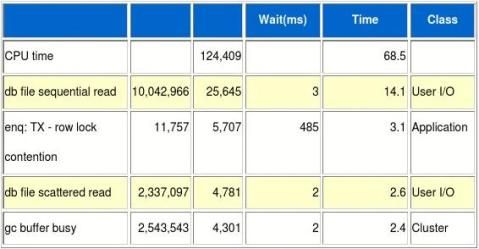
? 查看top 5等待事件
找到Top 5 Timed Events如下表,正常情况下CPU time处于第一位,一般占用比例超过50%,检查情况以实际系统运行情况为准。
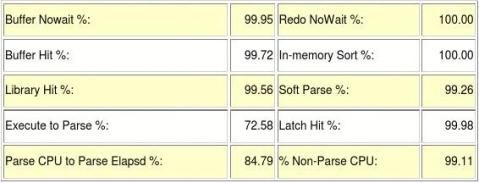
? 查看命中率情况
找到Instance Efficiency Percentages (Target 100%)
各项命中率接近100%最佳,其中Buffer Hit %和Library Hit %:都应该超过90, Soft Parse %最好能超过90
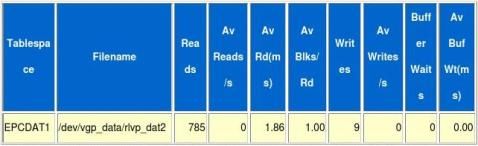
? 查看IO响应
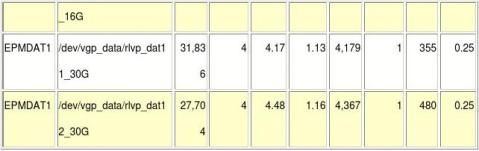
找到File IO Stats
查看数据文件的IO响应时间Av Rd(ms)一般<20以内
第二篇:oracle awr报告生成与分析
oracle awr报告生成与分析
Automatic Workload Repository(AWR)是10g引入的一个重要组件。
在里面存贮着近期一段时间内(默认是7天)数据库活动状态的详细信息。
1、生成awr报告
以oracle用户登录
sqlplus / as sysdba
@?/rdbms/admin/awrrpt.sql
2、分析报告
SQL ordered by Elapsed Time
Resources reported for PL/SQL code includes the resources used by all SQL statements called by the code.
% Total DB Time is the Elapsed Time of the SQL statement divided into the Total Database Time multiplied by 100
Elapsed Time (s)CPU Time (s)Executions Elap per Exec (s) % Total DB TimeSQL IdSQL ModuleSQL Text
Elapsed Time(S) : SQL 语句执行用总时长,此排序就是按照这个字段进行的。注意该时间不是单个SQL 跑的时间,而是监控范围内SQL 执行次数的总和时间。单位时间为秒。Elapsed Time = CPU Time + Wait Time
CPU Time(s) : 为SQL 语句执行时CPU 占用时间总时长,此时间会小于等于Elapsed Time 时间。单位时间为秒。
Executions : SQL 语句在监控范围内的执行次数总计。
Elap per Exec(s): 执行一次SQL 的平均时间。单位时间为秒。
% Total DB Time : 为SQL 的Elapsed Time 时间占数据库总时间的百分比。 SQL ID: SQL 语句的ID 编号,点击之后就能导航到下边的SQL 详细列表中,点击IE 的返回可以回到当前SQL ID 的地方。
SQL Module : 显示该SQL 是用什么方式连接到数据库执行的,如果是用SQL*Plus 或者PL/SQL 链接上来的那基本上都是有人在调试程序。一般用前台应用链接过来执行的sql 该位置为空。
SQL Text: 简单的sql 提示,详细的需要点击SQL ID 。
SQL ordered by CPU Time
Resources reported for PL/SQL code includes the resources used by all SQL statements called by the code.
% Total DB Time is the Elapsed Time of the SQL statement divided into the Total Database Time multiplied by 100
CPU Time (s)Elapsed Time (s)Executions CPU per Exec (s)% Total DB TimeSQL IdSQL ModuleSQL Text
记录了执行占CPU 时间总和时间最长的TOP SQL( 注意是监控范围内该SQL 的执行占CPU 时间总和,而不是单次SQL 执行时间) 。
SQL ordered by Gets
Resources reported for PL/SQL code includes the resources used by all SQL statements called by the code.
Total Buffer Gets: 964,486
Captured SQL account for 103.6% of Total
Buffer Gets Executions Gets per Exec %TotalCPU Time (s)Elapsed Time (s)SQL IdSQL ModuleSQL Text
记录了执行占总buffer gets( 逻辑IO ) 的TOP SQL( 注意是监控范围内该SQL 的执行占Gets 总和,而不是单次SQL 执行所占的Gets).
SQL ordered by Reads
Total Disk Reads: 5,606
Captured SQL account for 168.4% of Total
Physical ReadsExecutionsReads per Exec %TotalCPU Time (s)Elapsed Time (s)SQL IdSQL ModuleSQL Text
记录了执行占总磁盘物理读( 物理IO ) 的TOP SQL( 请注意是监控范围内该SQL 的执行占磁盘物理读总和,而不是单次SQL 执行所占的磁盘物理读) 。
SQL ordered by Executions
Total Executions: 20,124
Captured SQL account for 59.3% of Total
Executions Rows ProcessedRows per ExecCPU per Exec (s)Elap per Exec (s) SQL IdSQL ModuleSQL Text
记录了按照SQL 的执行次数 排序的TOP SQL 。该排序可以看出监控范围内的SQL 执行次数。
SQL ordered by Parse Calls
Total Parse Calls: 14,635
Captured SQL account for 69.0% of Total
Parse CallsExecutions % Total ParsesSQL IdSQL ModuleSQL Text
记录了SQL 的软解析次数 的TOP SQL 。
SQL ordered by Sharable Memory
Only Statements with Sharable Memory greater than 1048576 are displayed Sharable Mem (b)Executions % TotalSQL IdSQL ModuleSQL Text
记录了SQL 占用library cache 的大小 的TOP SQL 。
Sharable Mem (b) : 占用 library cache 的大小。单位是byte 。
SQL ordered by Version Count
Only Statements with Version Count greater than 20 are displayed Version Count Executions SQL IdSQL ModuleSQL Text
记录了SQL 的打开子游标 的TOP SQL 。
Oracle性能分析入门学习中,遇到Oracle数据库的性能问题,一般首要的步骤就是导出AWR的分析报告,AWR是10g中新引入的一个工具,在这之前一般是利用statspack。要导出AWR报告,只要利用Oracle的一个脚本即可以完成,下面是我利用script录制的一段导出AWR report的过程。
首先进入$ORACLE_HOME/rdbms/admin目录,在sqlplus下运行@awrrpt脚本,按照提示一步一步就可以达成,导出的格式有两种,txt格式和html格式。
在OTN上,有一个DBA新feature系列,第六周就是专门讲的这个feature,大家可以去那里了解一下(中文的)
Script started on Sun 27 Jan 2008 08:47:15 PM PST
[ractest@sun880-1 /u01/app/oracle/orahome/rdbms/admin]$ cd $ORACLE_HOME/rdbms/admin
[ractest@sun880-1 /u01/app/oracle/orahome/rdbms/admin]$ sqlplus / as sysdba
SQL*Plus: Release 10.2.0.4.0 - Production on Sun Jan 27 20:47:38 2008
Copyright (c) 1982, 2007, Oracle. All Rights Reserved.
Connected to:
Oracle Database 10g Enterprise Edition Release 10.2.0.4.0 - 64bit Production
With the Partitioning, Real Application Clusters, OLAP, Data Mining
and Real Application Testing options
SQL> @awrrpt
Current Instance
~~~~~~~~~~~~~~~~
DB Id DB Name Inst Num Instance
———– ———— ——– ————
2080780909 ORCLDB 1 orcldb1
Specify the Report Type
~~~~~~~~~~~~~~~~~~~~~~~
Would you like an HTML report, or a plain text report?
Enter ‘html’ for an HTML report, or ‘text’ for plain text
Defaults to ‘html’
Enter value for report_type: text
Type Specified: text
Instances in this Workload Repository schema
~~~~~~~~~~~~~~~~~~~~~~~~~~~~~~~~~~~~~~~~~~~~
DB Id Inst Num DB Name Instance Host
———— ——– ———— ———— ————
* 2080780909 1 ORCLDB orcldb1 sun880-1
2080780909 4 ORCLDB orcldb4 sun880-4
2080780909 2 ORCLDB orcldb2 sun880-2
2080780909 3 ORCLDB orcldb3 sun880-3
Using 2080780909 for database Id
Using 1 for instance number
Specify the number of days of snapshots to choose from
~~~~~~~~~~~~~~~~~~~~~~~~~~~~~~~~~~~~~~~~~~~~~~~~~~~~~~ Entering the number of days (n) will result in the most recent (n) days of snapshots being listed. Pressing without
specifying a number lists all completed snapshots.
Enter value for num_days: 1
Listing the last day’s Completed Snapshots
Snap
Instance DB Name Snap Id Snap Started Level
———— ———— ——— —————— —–
orcldb1 ORCLDB 66 27 Jan 2008 00:55 1
67 27 Jan 2008 01:55 1
68 27 Jan 2008 02:55 1
69 27 Jan 2008 03:55 1
70 27 Jan 2008 04:55 1
71 27 Jan 2008 05:55 1
72 27 Jan 2008 06:55 1
73 27 Jan 2008 07:55 1
74 27 Jan 2008 08:55 1
75 27 Jan 2008 09:55 1
76 27 Jan 2008 10:55 1
77 27 Jan 2008 11:55 1
78 27 Jan 2008 12:55 1
83 27 Jan 2008 17:54 1
84 27 Jan 2008 18:55 1
85 27 Jan 2008 19:55 1
Specify the Begin and End Snapshot Ids
~~~~~~~~~~~~~~~~~~~~~~~~~~~~~~~~~~~~~~
Enter value for begin_snap: 70
Begin Snapshot Id specified: 70
Enter value for end_snap: 71
End Snapshot Id specified: 71
Specify the Report Name
~~~~~~~~~~~~~~~~~~~~~~~
The default report file name is awrrpt_1_70_71.txt. To use this name, press to continue, otherwise enter an alternative.
Enter value for report_name:
Using the report name awrrpt_1_70_71.txt
WORKLOAD REPOSITORY report for
DB Name DB Id Instance Inst Num Release RAC Host
———— ———– ———— ——– ———– — ———— ORCLDB 2080780909 orcldb1 1 10.2.0.4.0 YES sun880-1 Snap Id Snap Time Sessions Curs/Sess
——— ——————- ——– ———
Begin Snap: 70 27-Jan-08 04:55:07 136 16.2
End Snap: 71 27-Jan-08 05:55:21 141 16.5
Elapsed: 60.23 (mins)
DB Time: 5,814.07 (mins)
Cache Sizes
~~~~~~~~~~~ Begin End
//此处有删减
————————————————————-
End of Report
Report written to awrrpt_1_70_71.txt
SQL> quit
Disconnected from Oracle Database 10g Enterprise Edition Release 10.2.0.4.0 - 64bit Production With the Partitioning, Real Application Clusters, OLAP, Data Mining
and Real Application Testing options
[ractest@sun880-1 /u01/app/oracle/orahome/rdbms/admin]$ exit
script done on Sun 27 Jan 2008 08:48:16 PM PST
-
怎样写好research proposal(中文)
大多数学生和刚起步的研究者都不了解什么是研究计划也不知道其重要性简单的说一个人研究计划的好坏决定了其研究的好坏一个构思欠佳的研究计…
-
research proposal范文
Researchproposal1TitleCormacMcCarthysTheRoadandAmericanModernEschatologyOrM…
-
research proposal
DevelopingResearchProposalsHandoutPreparedbyTedZornUniversityofWaikatoThisi…
-
申请文书Research proposal怎么写
申请文书Researchproposal怎么写首先先讨论最常见的SOP无论申请什么学校一定都会要求SOP这份文件通常分以下几个部份…
-
怎样写好research proposal
每个学术研究者必须经历的一道关卡就是ResearchProposal的写作它大致对应中文里的开题报告选题报告研究报告是一项研究开始…
-
oracle巡检报告模式
1.1硬件配置1.2数据库配置1.3基于Oracle的应用2系统和数据库的可用性2.1数据库监控:2.1.1Parameterss…
-
oracle数据库巡检报告模板
系统oracle数据库巡检报告文档控制修改记录审阅分发目录文档控制2检查总结5概要5总体概况5优化建议5介绍6目标6检查方法6检查…
-
Oracle数据库巡检报告
XXX数据库XXX巡检报告1第一部分操作系统参数检查211检查数据库cpuIO内存性能212检查Oracle服务进程22第二部分O…
-
oracle 数据库维护工作内容
oracle数据oracle数据库的维护老兄转一篇帖子我也是这样操作的载自oracle中文技术论坛从整体上介绍了一个dba的职责和…
-
20xxoracle数据库维保 招标文件
第一部分项目须知一项目编号二采购项目名称20xx年度oracle数据库续保三采购方式公开招标四采购内容数量及参数要求服务或售后服务…
-
oracle日常巡检
主要的监控指标应包括配置信息故障监控和性能监控主要工作包括1配置信息管理数据库配置信息包括数据库名数据库实例名版本信息数据库位数归…