雅思小作文笔记(个人整理内容最全)
文章结构:
Introduction, 1-2 sentences, rewrite the question
Body1, 1+X sentences, 第一句总体概括,X句具体介绍数字
Body2, 1+X sentences, 第一句总体概括,X句具体介绍数字
Conclusion, 1-2 sentences, 第一句介绍总数(可不写);第二句做总结。
开头段:1-2句,转述原题
转述原题3法:①添加单词 ②删除单词 ③替换单词(注意:改动不需过多,3-4处,即可)
原题一句变两句,两句变一句。全部改写,要保证语法、句型的正确性。开头段的时态:永远一般现在时
【原文】
【改写】
The diagram gives a breakdown(明细表) about different attitudes among undergraduate and postgraduate students towards equipments of a UK college in the year 2004.
【原文】The chart below shows the different levels of post-school qualifications in America and the proportion of men and women who held them in 1999.
改后:The bar chart illustrates the diverse levels of post-school certificates in the US and the percentage of males and females holding them in 1999.
Level out (变得水平;持平)
Example: ’s degree and with a Doctoral degree.
- 1 -
句型、词汇、短语:
As shown in the first/second …….. ,
According to the …….. ,
Overall, it can be seen that
This table shows a striking difference/similarity between
The most striking feature of the graph is the sudden increase in the popularity in the computer games.
Another fact worth noticing in the graph is that …….后面接完整的句子 如果要跟名词不加that
Another fact worth noticing in the graph is the high cost of fuels.
The most remarkable point is that …….
The graph shows the difference between the percentages注意用复数of males and females doing full-time jobs.
在表示百分数时可以用percent或percentage percentage的一个意思就是百分比(名词)就不能直接跟在数词后面,要表示"百分之36"时,只能说"a PERCENTAGE of 36" 而不是"36 PERCENTAGE"(因为percentage只能作名词);
前者用法是: 数词+percent+of+sth;这时后面谓语的单复数以percent后面跟的主语为主,例如:
2 percent of the apples(这里是复数的可数名词) are(所以用复数) eaten.
2 percent of the apple(这里是单数,指的是一个苹果的一部分) is(用单数) eaten.
2 percent of the water(这里是不可数名词) is(单数) drunk.
后者的用法是The percentage of +sth+ is, 注意这里不管后面跟的是什么词,都用is(这里忽略别的时态)
1.The percentage of the students is 46.
2.The percentage of the water is 46.
The size of the population will increase shaply in the future.
.75.6 percent of the male population over sixteen ... …16岁以上男性人群的75.6%.
A small/large proportion of students are ……..
In Britain people spent the smallest amount of money on personal + sth.
大量 a large/considerable/substantial number of 可数 a large/considerable/substantial amount of不可数
少量 a small/limited/tiny number of a few of a small/limited/tiny amount of a little of
Lots of /a lot of /plenty of 即可用于可数也可用于不可数
过去一段时间内的情况变化,用过去式。
The amount of energy consumed by industry doulbed during the last decade of the twentieth century.
The share of global resources consumed by poorest countries went down during that period.
A is only marginally greater than that of B.
Double triple n, adj, vi, vt
There was a substantial decline in the ……
Housing prises in the UK fell consistently from 2010 to 2012.
In the following year 表达时间的小词
时间区间表达:
The period between 10 o’clock/1991 and 12 o’clock/2000.
Then, from 1910 to 1998, it remained stable.
Then, in the next 20 years/20 hours, the number of ……/ the quantity of …….
Over this span of 28 years….. During the 28-year period……
From this point/2000 onwards……用于有标志性节点的链接
- 2 -
The graph shows how the amount of water used worldwide changed between 1991 and 2001. between …and…
in March, 2002= in the month of March, 2002
…..tripled.
Over the following three/two years days months
Remain 分词remained remaining
remainder 剩余物剩余部分
In 1980 Australia used coal as the main electricity source (50units), and the remainder was produced from natural gas, hydro power (each producing 20 units)and oil(which produced only 10 units).
The remaining 40 units were produced largely from oil and nuclear power,……
+from (第一时间) to (第二时间) / between (第一时间) and (第二时间)
对比链接词:
By contrast similarly in comparison
以上句子间对比,句内对比 while/whereas
Europe had as much as 9.8% of degradation due to deforestation, while/whereas the impact of this on ……was minimal/was less significant.
连接词:at first=initialy, then, after that, from this point onwards, finally=eventually, subsequently, afterwards
More specifically = more precisely
时态和语法:B1P243
Teacher’pay remained the biggers cost, reaching 50% of total spending in 1991 and ending at 15% in 2001.现在分词详述变化趋势 The population who own computers 有些名词可以用现在分词修饰,有些不可
constituted /represented 20% of the total in 2001.
没有给出具体年代时间说明描述的是一般情况,用一般现在时态。Stands at, stood at
给出具体年代的数据,过去的用过去时,将来的用将来时。
Will +动词原形:will continue to rise in the next two decades.
A is expected to continue, reaching 40tonnes in 2030.
This rising trend is expected to continue, reaching 40tonnes in 2030.
Constant 恒定的;不变的; constantly 不断的经常的
Consistent consistently始终如一的;
词汇整理:
趋势:saw an upward trend /witnessed a downward trend saw an opposite trend
上升:increased to 20% reached 4000/the highest point in 1980 soar/soared to rocketed to
下降:fell consistently from 2001 to 2010 dropped swiftly to plummeted to
波动:remained stable/constant 一个是稳定 一个是不变 注意区别 remained relatively stable
Reached a plateau at …….
Fluctuated between 25 hours and 35 hours
steady steadily 一adj一副词
预期:描述将来的变化趋势
- 3 -
A more dramatic rise is predicted betweem 2020 and 2025.
The figure is expected to reach 23% by 2020.
The proportion of …….in all three categories is expected to increase to almost 25%.
第一 用is,因为是一个数字 第二 expected/projected/predicted 后要有to, to后用原形动词 超过:surpass overtake
The growth rate of ……is expected to surpass that of ……by 2030.
倍数:is twice as many as is three times as many/much as doubled tripled
the graphs show a threefold increase in the number of... 该图表表明...的数目增长了三倍。
鲜明对比: be in marked contrast with
This is in marked contrast with 1990 when 60% of those who held an undergraduate diploma were men.
This new trend is in marked contrast with the trend it experienced in the 1980s.
Whereas 而 while/whilst 而同时 前者对比更加强烈
Line: 变化趋势+明显的结论,结论可以在第二段第三段,但要给结尾留内容。 - 4 -
描述重点:起点 终点; 最高值 最低值;变化趋势:上升 下降 线的相交 变化趋势的缓急
例题:B1 P226 239 / 242 J9p168(未来变化趋势) / J6p30 J8T4
练习:J5P30/163
句型词汇:
Just under, just over, increase/decline repidly, experience a slight growth/a sharp rise 两个都做名词 increased more slowly 用于开头描述起点:多用with. 不适合用with的地方用stand at/stood at 一般为后者
Petrol and oil are the dominant fuel sources throughout this 25-year period, with 35 units used in 1980,过去分词表被动和过去,rising to 45 untis in 2012. 现在分词表主动和现在
In 1979 beef was by far the most popular of these foods, with about 225 grams consumed per person per week.
Cars remained top among the modes in the 15 years, with its average miles increasing considerably from 3,199 in 1985 to 4,806 in 2000.
In 1940 the proportion of people aged 65 or more stood at only 50% in Japan, approximately 7% in Sweden and 9% in the USA.
用于描写折线,有单边趋势:
The amount of goods transported by water was constant(adj.) at 40 million tonnes from 1974 to 1978, and then it showed a substantial growth, rising to almost 60 million tonnes after which it plateaued for about 20 years before starting to rise/decline gradually again.
用于描写折线,有小的、不易描述的波动:
The …..of ….has been risen steadily over the 20 year period while the …over the same period with a slight increase in popularity since 1985.
In spite of some fluctuations in the expected percentages, the proportion of older people will continue to rise in the next two decades. 单线描述,超过某一量:
The consumption of chicken, on the other hand, showned an/a upward/downward trend, overtaking that of lamb in 1980 and that of beef in1993. By 2004 it had soared to almost 250 grams per person per week.
The price remained/was constant during the next 20 years.
量很小:
Water used in the industrial and domestic sectors also increased, but the amount/consumption was minimal until 1991.
未来的数字的预测:
A is expected/ projected/ predicted to reach……
A is projected to more than doubled by 2015.
The proportion of elderly people in all three countries is expected to increase to almost 20% in 2020.
In spite of some fluctuations in the expected percentages, the proportion of older people will continue (will后接动词原形,构成一般将来时)to rise in the next two decades.
描述两条很相近的线:
A and B are similar over the period. From 20 and 15 respectively in 1980, A showed an initial fall, B showed a gradual increase, they were equal between 1985 and 1990. A is predicted to increase steadily to 30 in 2018, whereas after 2014, B will remain stable at 50. 一条线上涨或下降后回到原点:
After /some fluctuations/a slight increase/a decline/, A had fallen back to the 1980 figure. It is expected to maintain this level until 2030, while the others will rise slightly after 2025.
J9范文第三段:
Table:
- 5 -
描述重点:单项的变化趋势(增加、减少)或大幅增加大幅减少 不同项目间数字的大小 介绍不同数字
结论写单项和总数的关系
Howerver, at the same time, the percentage of student population who came from abroad remained almost unchanged between 1928 and 1985,being 5% and 6% repectively, but rose markedly after that ,so that by 2008 foreign students represented 20% of the total.
例题1:J6T1
重点准备:用于描写项目不多的题目,会配合其他图形出题!三个项目写了三句话!
The table illustrates the differences一个名词irrigated land in Brazil (26.300 km) with that in the UK ( ).
This means that a huge amount of water is used in agriculture in Brazil, and this is reflected in the figure for water consumption per person: 356m compared with only 8m in the Congo.
With a population of 176 million, the figures for Brazil indicate how high agricultural water consumption can be in some countries.
例题2:
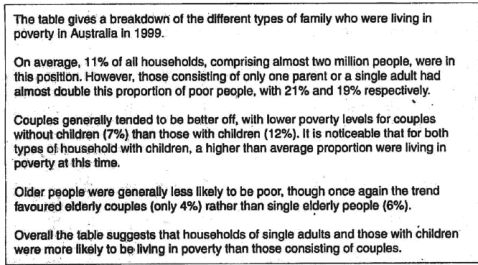
The table below shows the proportion of different categories of families living in poverty in Australia in 1999.Summarize the information by selecting and reporting the main features, and make comparisons where relevant.
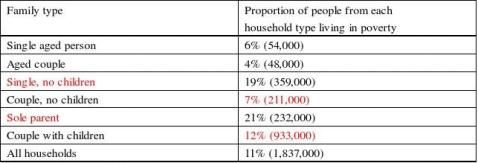
红色为出题故意调整选项,为一类!
- 6 -
总结:
comprise vt 组成Together they comprise your character. 它们一起构成你的性格。be comprised of 由…组成 consist vi. Consist of
comprising almost 2 million people who were living in ……
overall the table suggests that….. were more likely to be living in poverty than those …….
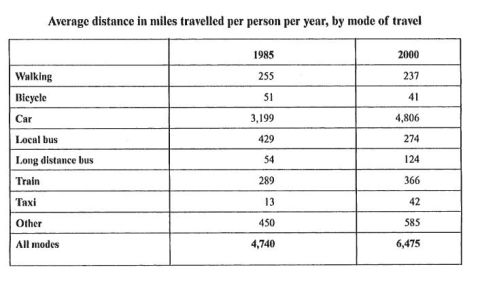
例题3:J6T2
范文:表格有很多项需要做比较的,分类比较!
The table demonstrates how different modes of travel changed in England in 15 years spanning from 1985 to 2000. 题目改写
In general, the modes are classified into two kinds in terms of average miles travelled per person per year: one enjoyed rising popularity while the other decreasing. The travel modes which gained popularity in the period included car, long distance bus, train, taxi and other. Car remained top among these modes in the 15-year period, with its average miles increasing considerably from 3,199 in 1985 to 4,806 in 2000. Long distance bus and taxi seemed to be warmly welcomed by travelers, so average miles travelled in this two modes almost tripled.
Travels by walking, bicycle and local bus lost travelers’ favor in the one and a half decade.Average travelling distance by local buses suffered the biggest decrease, dropping from 429 to 274, while the number of miles by walking and bike fell slightly from 255 to 237 and from 51 to 41 respectively.
Overall, the number of miles travelled by the average per person per year rose from 4,740 miles in 1985 to 6,475 miles in 2000, with the increase of car accounting for
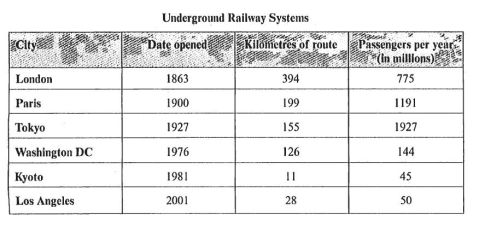
例题4:J5T4
The table below gives information
about underground railway systems in six cities.
- 7 -
范文1:比较项目之间的区别
The table demonstrates the data regarding the subway system in six cities, including Date opened, kilometers of route and passengers per year (in millions).
In terms of Date opened, London has the most time-honored (1863) subway system among the six cities while subway system in Los Angeles is the newest one opened in 2001. (最老,最新)Systems in Paris and Tokyo were opened in 1900 and 1927, respectively. 时间顺序After that, systems in Washington DC and Kyoto were opened in 1976 and 1981 differently.
As for the size/length of the railway system, London still ranks the first, meaning it has the longest subway system (384 kilometers) among the six cities, which is roughly twice as large/long as the system in Paris. (最长)By contrast, subway system in Kyoto is shorter (11 kilometers) than the others even thought it opened in relatively recent year. (最短)The kilometers of route in Tokyo, Washington DC and Los Angeles are 155, 126 and 28 differently. 排长长
The third part is passengers per year in millions. More precisely, the top three are Tokyo (1927), Paris (1191) and London (775). Underground railway system in Washington DC’s has 144 millions passengers per year. Systems in Los Angeles’s and Kyoto’s carry fewer passengers per year (50 and 45, respectively).
Thus, it can be clearly seen from the table that the subway systems in Tokyo and Paris serves for more passengers whereas the systems in Los Angeles and Kyoto carry fewer passengers mainly because of the short route.
范文2:
First, the subway systems in the six cities were opened in time sequence with London being the earliest (in 1863) and Los Angeles the latest ( in 2001 ). The underground railway system had their prime time in the 20th century, which saw the construction of 4 underground railway systems respectively in Paris (1900), in Tokyo (1927), in Washington DC (1976), and in Los Angeles (1981).
Second, seen from London to Los Angeles, which happened to be in chronological order of subway construction, the
above-mentioned six cities roughly revealed a trend of sharp decrease in the length of the subway route. London ranked No. 1 in this - 8 -
respect, with a length of 394km; Paris came next with 199km; Tokyo was No. 3 with 155km; Washington DC ranked No. 4 with 126 km. Kyoto and Los Angeles were the most interesting, with merely 11km and 28km respectively, nothing comparable with the top 4 cities.
Third, we see some really unexpected figures about the number of passengers transported by the subway system in these six cities. Tokyo took the lead with 1.927 billion; Paris came next with 1.191 billion; London was No. 3 with 775 million; Washington DC was No. 4 with 144 million. Los Angeles and Kyoto had 50 million and 45 million respectively. Therefore, we can see the big difference as compared with other cities.
Overall, the six cities revealed great differences in the history of subway construction, the length of subway lines and the yearly passenger transportation capability.
例题5:
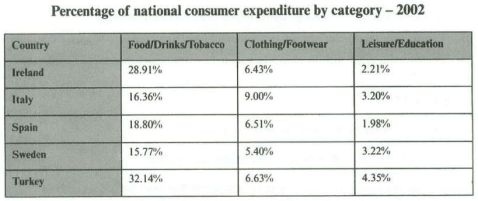
The table above compares the percentage of national consumer expenditure by different categories in 2002.
As can be seen clearly, consumers spending on Food/Drinks/Tobacco accounted for the largest percentage in all five countries listed in the chart. This figure was highest in the Turkey at 32.14%, followed by 28.91% in Ireland, 18.8% in Spain, 16.36% in Italy and 15.77% in Sweden.
In terms of Clothing/Footwear, consumers in Italy spent the most on this item at 9%. This figure was approximately 2.5% higher than the amounts spent in Turkey, Spain and Ireland, and 3.6% higher than that spent in Sweden.比较数字之间的大小
That last consumer item included in the chart is Leisure/Education. The largest amount of 4.35% spent on this item in Turkey was more than twice as high as the amount spent in Spain, which had the lowest figure.
- 9 -
Bar chart:
审题重点:柱子之间的变化:增加 减少 波动
类别之间的差异:同类 不同类
练习: J7T3 J9T2
句型和词汇:
第一段可以交代改图按什么类型分类:
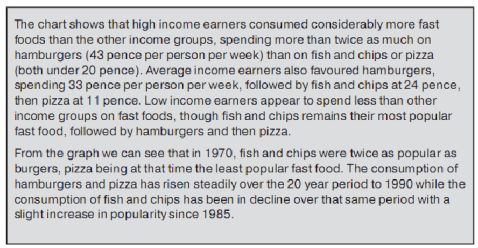
The bar chart shows the amount of money expended on fast foods according to three different income groups. we can see immediately that there were substantial differences in the proportion of men and women at different levels.
The marriage rate was consistently higher than the divorce rate over the thirty-year period.
例题1:两个柱子按时间年代种类比较 J6T4 B1 237
More precisely, the number of marriages stood at 2.5 million whilst the number of divorces was 1 million.
The second bar chart shows that married people accounted for the the adult american - 10 -
As for other categories, the percentage of ……who were never married was 17% in 1978 and 20% in 2000.
Represented constituted amounted to
例题:2
B1 247
Average income consumers also favoured ……., spengding 33 pence per person per week, followed by fish and chips at 24 pence, then pizza at 11pence.
A being at that time the least popular fast food. 那个时间最不受欢迎的快餐
The …..of ….has been risen steadily over the 20 year period while the …over the same period with a slight increase in popularity since 1985.
A are the most popular fast food in the high and average income groups(45and 56 per person per weak ,respectively).
(17…..), but they are the most popular food with those in the low income groups(19…..).
Outlines the general patterns of ……
From just under 100 grammes in 1970, people in Britain ate over/almost 5 times this amount of ……by 1990. - 11 -
Twice/3/4/5 time the number/amount of ….by 2000. 到了多少年 是多少倍
But not so dramatic = but less significant
例题3:三个柱子 按时间年代比较
增长的 car 减少的 bus 波动的 train tube
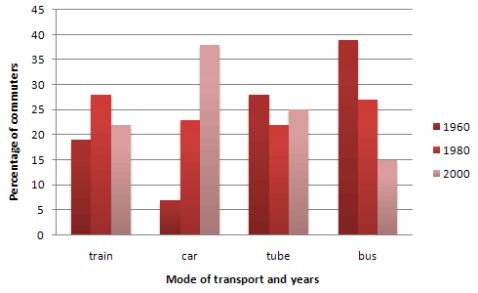
The graph below shows the different modes of transport used to travel to and from work in one European city in 1960, 1980 and 2000. 题目
The bar graph shows how the four commuting patterns changed in a certain European city in the years 1960, 1980 and 2000. 19601980, but then fell back to about 23% in 2000reach 25% by 2000.
whereas the popularity of buses has declined since 1960, falling from just under 35% in 1960 to 27% in 1980 and only 15% in 2000.
The graph indicates the growing use of cars for commuting to work between 1960 - 2000, and the continued decline in the popularity of buses from being the most popular mode of transport in 1960 to the least popular in 2000.
例题4:两个柱子按类别比较 J4T3 B1 221
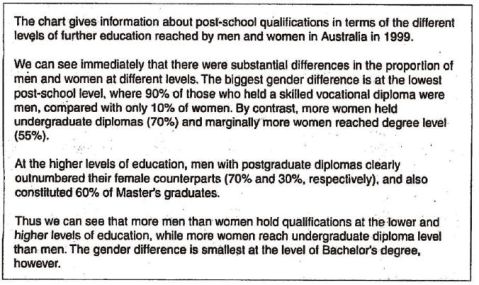
低学历 (skilled vocational diploma)女低于男
中学历 (undergraduate diploma, Bachelor’s degree)女高于男,而且Bachelor’s degree的两者数值基本相等。 高学历 (postgraduate diploma, master’s degree)女低于男
- 12 -
where 90% of those who held a ……. were men, compared with only 10% of women
we can see immediately that there were substantial differences in the proportion of men and women at different levels.
Outnumbered 数目比…..多 their counterparts 配对物
The gender difference is smallest at the level of Bachelor’s degree, however.
Pie chart:
练习: J9T3
占比最大 占比最小 单一项目占比变化趋势 不同项目间的比较
例题1:J8T2 B1 P244 三个饼图
While other worker’s salaries saw a fall from 28% in 1981 to only 15% of spending in 2001, teacher’s pay remained the biggest cost, reaching 50% of total spending in 1991 and ending at 45% in 2001.
例题2:J8T1 一个饼和一个table
Constituting/representing 35% and 30% respectively 7%。
These causes affected different regions differently in the 1990s, with european having as much as 9.8% fo degradation due to deforestation, while the impact of this on … and … was minimal, with only 7% and 0.2% of land affected respectively.
年代要加the, as much as 表示多,这个东西太狠了,没有其他意思
with 后用过去分词表数量: with only 5% of total expenditure spent on books and other items
- 13 -
占比最大:
European, with the highest overall percentage of land degraded(23%).
例题3:J7T4
Remain 分词remained remaining
remainder 剩余物剩余部分
In 1980 Australia used coal as the main electricity source (50units), and the remainder was produced from natural gas, hydro power (each producing 20 units)and oil(which produced only 10 units).
The remaining 40 units were produced largely from oil and nuclear power,……
Producing almost 75% of electricity, at 126 units.
流程图:
语法多被动,时态一般为现在时!
第一句:
The diagram illustrates in four stages/phases how 加一个完整的句子how the agency gathers its information.
How the village developed from 1984 to 1994.
It takes ten days for each egga silkworm that feeds on ……to 不要丢
时间;
The first period was from 1820 to 1830, at this time……
The next/second perion stretched form … to …
This stage six weeks...........
结尾段:overall, the diagrams clearly indicate the process of how cocoons are created and then how silk cloth is produced. And 尽量用in order to +动词原形 替换
做名次时 :Procedure 程序 /process 工艺流程
- 14 -
-
雅思小作文技巧及范文
雅思小作文写作技巧及范文一图表类型饼状图直方图或柱形图趋势曲线图表格图流程图或过程图程序图二解题技巧A表格图1横向比较介绍横向各个…
-
雅思小作文范文
IELTS套句式写作大全第一部分TASK1图表写作套句精选1thetableshowsthechangesinthenumbero…
-
老外的标准雅思小作文范文(分享)
第三节观点之间的连贯Firstlyprimarilyinitially其他参考vThefirstandmostimportantt…
-
【雅思小作文】组合图(曲线图+饼图)写作范例
组合图是雅思小作文里常考的题型之一其写作非常值得我们深入研究现专供一组合图组合图饼图或piechartlinechart写作范例和…
-
雅思小作文模版
开头1Thisgraphpiecharttablebarchartreflectstheratepercentageproport…
-
雅思小作文总结
1.Localfixedlinecallswerethehighestthroughouttheperiod,risingfrom…
-
雅思table小作文范文总结
Thetablebelowshowstheproportionofdifferentcategoriesoffamilieslivinginpover…
-
总结雅思小作文
雅思作文模板经典同意与否文体Thereisnodenyingthatthespecificissueofsth./或接whethe…
-
总结雅思小作文
雅思考试图表作文的常用词1.有用的词上升:increaseriseascendcoresurgegoupclimbmountlev…
-
雅思小作文饼图写作技巧总结
雅思小作文饼图写作技巧总结饼图是雅思小作文写作中最常见的一种形式,所以大家在备考雅思小作文写作的时候,一定要准备一些关于饼图的雅思…