雅思写作小作文表格图实例分析
雅思写作小作文表格图实例分析
朗阁雅思培训中心
表格图是雅思写作小作文中常考图形之一,也是烤鸭们在备考时必须要准备的一类题型。那么烤鸭们具体应该如何准备表格图呢?下面,朗阁雅思培训中心的专家将以一道具体的实例,就这一题型的解题思路和步骤做出详尽的分析和解答。
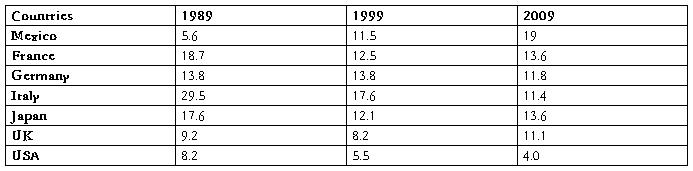
The table below shows personal savings as a percentage of personal income for selected countries in 1989, 1999 and 2009.
Personal savings as a percentage of personal income
一、审题,决定大体写作方式
首先,读题目,了解到这幅表格图是关于“几个国家的人民个人收入中存款的百分比”以及三个时间点(据此,正文部分描述存款率是时态基调为过去时)。表格上方的title和题目表述一样,没有额外信息,因此,读一遍即可。
然后,审具体表格,决定大致写作方向和方式,即分段方式。表格的审图需要注意以下几个方面:横轴,纵轴和总体数据特征。此图中的横纵轴分别是时间和7个研究对象——7个国家。横纵轴中间有一栏为时间,那说明,此图原则上应该按曲线图原理来写——即,描述7个国家存款率上升或下降趋势;但是,经过下一步对表格中数据总体特征的总结发现:7个国家的存款率在这一段时间内总体呈现下降趋势。这一发现说明,如果继续按照曲线图原理描述,文章会非常单调,而且对比的空间也不大;相反,同一年份里,几个国家之间的差距很大。因此,正文部分应该按时间分成三个段落,对比同一时间内,7个国家之间的存款率的高低。
最后,审题的最后一关是总结表格中数据的明显特征。正文主要是从时间角度,纵向对比几个国家。但是,我们同时也需要反方向观察和对比,也就是,几个国家内部不同时间内存款率的起伏。我们发现,正如以上提到的一样,7个国家的存款率在这一段时间内总体呈现下降趋势。
二、文章各部分的写作分析
小作文的基本结构包括三部分:开头段,正文和结尾段。
首先,开头段落的写作方式相对比较简单——介绍接下来即将描述的是什么内容,即,改写题目。具体可以通过近义词,修改句子结构,加信息等方法实现,如:
The table shows the proportion of personal income put aside as savings in seven different countries in 1989, 1999 and 2009.
正文第一段描述1989年7个国家的存款率情况。Italy的最高,应作为第一个介绍对象单独说明。Mexico的最低,也应该提及。剩下的五个城市的数据无需一一提及,可挑选一两个相对较重要的数据做代表,通过“followed by...”等表示排序的句型进行介绍。同时,一定注意句子与句子之间的连贯性。如:
According to the table, in 1989, Italy had the highest savings rate of 29.5%, followed by France with 18.7% and Japan with 17.6%. However, Mexico had the lowest rate—only 5.6%.
正文第二段对比第二个年份1999年几个国家的存款率。最先描述的数据可以是这一年最大的数据,也可以为了和1989年对比先介绍89年排名第一的国家。碰巧,此图中Italy既是99年最大值也是89年最大值,所以,先介绍意大利。同上,最低和中间数据的代表也应提及。应该注意的是,此时,99年的数据,尤其是和89年比变化大的,应该适当和89年进行比较。如:
By 1999, Italy was still the leading country, though its saving rate had dropped to 17.6%. Germany was next with 13.8%(same as that in 1989) , and the rates in France and Japan were close behind. In Mexico, the savings rate had almost doubled to 11.5%. By contrast, the UK and the USA had the lowest rates, with 8.2% and 5.5% respectively.
正文第三段写作方式同正文第二段,重点纵向对比国家间比例,同时注意和前一年数据的比较。比方说:
In 2009, the savings rates leveled out considerably across the seven countries, with France and Japan leading with 13.6%, followed by Germany, Italy and the UK at around 11%. Personal savings in North America dropped sharply, with the USA at 4% and Mexico at a very low 1.9%.
最后,结尾段总结该表格的明显特征,即7个国家的存款率在这一段时间内总体呈现下降趋势。
Overall, the proportion of income as savings in these countries, generally speaking, declined over this thirty-year period.
三、检查
落笔成文后,如时间允许的话,还可以进行快速的检查,查看是否有重要数据的遗漏、时态错误、单词错误拼写等小问题,尤其是平时练习中经常犯的错误。
总而言之,表格图的写作并非难事,考生们只需要按照上例顺序,了解图形特征,掌握表格类型,积累表达手段,注意连贯性和表达准确性,相信一篇出色的表格图作文应该是不成问题的。最后,朗阁雅思培训中心祝广大考生考出雅思好成绩。
第二篇:雅思写作_表格图范文

http:// bailiedu.com/ The chart shows the number of mobile phones and landlines per 100 people in selected countries.
Write a report for a university lecturer describing the information given.
? You should write at least 150 words.
? You should spend about 20 minutes on this task.
The
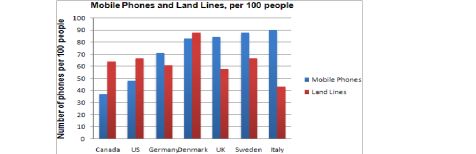
graph shows the number of mobile phones and landlines per 100 users for provided countries. Overall, most of the countries included in the graph have more mobile phones subscribers than landlines.
Most European countries have high mobile phone use. The biggest users of mobile phones are the Italians, with 88 cell phones per 100 people. For example, Italy has twice as many mobile phones as landlines, with 88 mobiles per hundred people compared to 45 for landlines. Mobile phone use is low in Canada, with fewer than 40 phones per 100 people. And Denmark is also unusual because it has slightly more landlines than mobile phones.
However, in some countries, the number of landlines is higher than the number of mobile phones. One example is the USA, where the number of mobiles, at 50 per 100 people, is 地址:北京市海淀区海淀北二街8号 中关村SOHO A区 2层
电话:400-890-6000 传真:010-82607462
网址: 邮编:100080

http:// bailiedu.com/
much lower than the number of landlines, at almost 70 per hundred. A similar pattern can be seen in Canada. The highest number of landlines in the graph is in Denmark, with about 90 per 100 people. In contrast, the lowest figures for fixed lines are in Italy and the UK.
In conclusion, it seems that mobile phone use is higher in Europe than in North America. (205 words)
地址:北京市海淀区海淀北二街8号 中关村SOHO A区 2层
电话:400-890-6000 传真:010-82607462
网址: 邮编:100080
-
雅思写作-小作文范文-柱状图
柱状图C1T3题目Thechartbelowshowstheamountofmoneyperweekspentonfastfood…
-
雅思小作文范文
IELTS套句式写作大全第一部分TASK1图表写作套句精选1thetableshowsthechangesinthenumbero…
-
雅思小作文技巧及范文
雅思小作文写作技巧及范文一图表类型饼状图直方图或柱形图趋势曲线图表格图流程图或过程图程序图二解题技巧A表格图1横向比较介绍横向各个…
-
雅思小作文组合图范文和写作思路
今天环球雅思为正在备考雅思写作的考生介绍雅思小作文组合图范文和写作思路我们先从雅思小作文组合图范文开始雅思小作文组合图一Write…
-
雅思小作文写作模板
雅思小作文曲线图写作步骤先根据横轴分析变化然后再进行比较第一段介绍核心信息eg时间地点研究对象一句话即可第二三段先分析第一个时间点…
-
20xx年雅思小作文考试题目总结
bailieducom20xx年雅思小作文考试题目总结20xx年这个百年不遇的二月就要过去了这个二月非常的神奇共28天有四个星期日…
-
雅思写作图表小作文最容易出现的五大误区
No1分析图表背后的原因这是中国学生的习惯性毛病写作文时候总喜欢写上为什么雅思小作文是客观性写作只要求通过图表描述和总结不能写上为…
-
雅思写作-小作文范文-表格
雅思小作文表格题写作技巧雅思小作文中表格题是经常出现的一种也是相对比较简单的一种那么雅思小作文表格题有哪些写作技巧呢下面为大家整理…
-
雅思写作小作文线形图表题(附范文)
雅思写作LINEGRAPHWRITINGTASK1Test2CambridgeIELTS7Youshouldspendabout2…
-
雅思考试小作文表格,曲线技巧及范文
小作文写作原则1客观不要猜原因不要做预测2准确roughlyapproximately3概括4详尽5多样词汇语法华丽审题步骤题目标…
-
雅思小作文表格图攻略及范文
雅思小作文表格图攻略及范文类型纵向比较即自身前后的比较具有历史性可转为曲线图横向比较与其他同类事物的比较原则首句永远概括全部中间永…