老外的标准雅思小作文范文(分享)
第三节 观点之间的连贯
Firstly/ primarily/ initially/
其他参考:
v The first and most important thing is (concerned with)…
v The first important factor being taken into account is that …
v … should be put in the first place
v A crucial element has to be considered with regards to teaching quality.
v We may mention/ point out the indisputable/ undeniable fact that …
Secondly/ additionally/in addition/ also/ admittedly/ furthermore/ moreover/ besides/
v Besides, we should not neglect that …
v Apart from this (in addition to this), another aspect/ factor is concerned with …
v Another special consideration in this case is that …
v Another equally important/ essential consideration is …
v Another reason lies in the fact that …
v Another reason lies somewhere close to the fact that …
v Similarly, another thing that also deserves our special attention is …
v Another important fact which goes strongly against it is ….
v What is also noticed is that …
v But that is only part of the explanation. Perhaps the most significant one goes this way.
1)用连接词(详见单词书201)
因果:because,as ,for ,since, lead to ,result in (from), contribute to consequently, hence ,so ,therefore, as a result ,as a consequence, accordingly
递进:furthermore, what's more ,moreover,incidentally, meanwhile, besides, particularly. similarly at the same time , in addition,
转折:but ,however, conversely ,anyway, desptie,
although ,though , likewise, nevertherless ,otherwise, after all, all the same (虽然,但是) at the same time (可是) not withstanding(虽然) on the contrary
PS: 连词:because ,as ,for ,since, even if , although when 主句.conj+从句
副词:主句,adv,主句
IV.结论段与备考策略
第一节 结论段
结尾段:总而言之/显而易见+如此建议/ all in all, to sum up, to summarize, as a conclusion
--总而言之/显而易见:结尾标志词 in conclusion, +总结主题段落阐述的内容/或用不同语言重现文章的主题/ 作者表态
--如此建议:最有价值的废话
v 同意与否:表态+(建议)p57~58
v 利弊:表态+建议 p61
v 原因/问题/解决:总结+建议 p63
回顾 1
Task 2 40分钟完成
高分词汇:AA,AB重现;连字符词语: win-win situation; 名词化短语;一词多义的单词:bridge n. / vt. Brave adj. / vt. 勇敢面对
六大结构: 后置定语;排比句 not only… but also…等;同位语;名词性从句;虚拟语气;否定兼倒装:Only in this way can we…; Not only verb + subject
First and Last注意首句和末句;首段和末段;每段的首句和末句
五种题型:(1side一分写法,正或反面选其一;2side两分写法,正反面都要写,易拿高分)
 Do you agree /disagree? What is your opinion? (1/2-side)
观点性辩论文 To what extent do you agree or disagree? (1/2-side)
Discuss both sides… (2-side)
 现象/说明性论述文 Problem-Solution (Why-Because, Causes-Effects) (2-side)
General-Particular (2-side)
1 辩论文(一分法/二分法)
一分法 完全赞成/反对
Part 1 我同/反 间接或直接点题
 Part 2 同/反 1
同/反 2 理由,举例
Part 3 我同/反
二分法 7-8分
1 2 3
Part 1 我同/反/中立 间接点题
Part 2 同 同 反
反 反 同
Part 3 我同/我反/中立 我同 我反
3种写法: 势均力敌 同=反 先扬后抑 同>反 先抑后扬 同<反
第一种“同=反”比较难写,不要轻易尝试
Part 1 首段末句必须中立点题
Part 2 中间部分必须互反: 利弊,迟早,新旧,今昔对比互反
Part 3 末段首句必须明确表态 (赞成/反对)
2.论述文
Question-Answer Pattern
Part 1 What Part 2 Why1 Why2 Part 3 How
复习总结 2
命题形式:
1.arguement (辩论式) 50% 问A.B好不好
2.report (论说式) 20% 问原因,解决办法
3.mixed (混合式) 30% 有两个以上问号
写作格式
1.不写题目
2.分段
3.用铅笔写(B型或自动笔)一行8-10个字
PS: 注意大小写,注意标点,不要用缩写如don't,书写工整
ARGUEMENT
一, 五段论式:
................Introduction............................
.......................Reasons (2-3)............................
.......................让步段.................................
.......................Conclusion..............................
小作文 ,是个看似困难实则简单的写作类型。很多同学觉得就像我们小时候的看图说话,但拿到图后却又不知道该如何写。本文将带你由繁入简用二十个小时彻底搞定小作文。
第一阶段
第一个5小时:热身
无论是什么样的 英语作文,都离不开语法的支持。它就像修房子的地基一样,只有牢固的语法基础,作文这座摩天大楼才能拔地而起。就小作文而言,我们可以将语法复习分为两个部分。即时态和句型。众所周知,英语十二大时态乃语法之根本,然而雅思小作文仅需两个时态即可搞定!从考官的满分作文来看,除了首句用一般现在时,后面的句子都可以用一般现在时。当然有一种情况例外,就是如果给你的图表上面有对将来的预测即你当前时间以后的情况的话我们就用一般现在时加表预测的 词汇 来使用就可以了。句型方面要求也不是很高,在我们中学阶段所学的简单句和复杂句上面找寻最合适的就行了,原则上雅思小作文并不推荐大家使用太过于复杂的长难句。从满分范文上就能看出端倪,一篇好的小作文就是在它身上抠不出更多的东西。所以,小品词,插入语,非谓语动词等的用法尤为 关键 和重要,请大家在准备阶段的时候多加复习。
第二个5小时:练习
此阶段的练习并非小作文的练习,而是在正式进入攻坚阶段前的准备性练习。请问你准备好了开始写作文了吗?相信大部分同学还没准备好!怎么办?拿出你的新概念英语,不要看原文,只看作者翻译的中文,尝试着再翻回到英文去。看看你的版本和英文原版还差多少。坚持一段时间后你会发现你的翻译水平上升了很多,至少是在句子翻译上面你会逐渐习惯原文的精炼和巧妙。此乃前期阶段练习写作的不二之法!!
第二阶段
第一个2.5小时:破冰
雅思官方规定了小作文写作时间20分钟最低字数150字,大作文写作时间40分钟最低字数180字。从这个层面就很好的印证了官方的那句话:”Writing Task 2 carries more weight.”小作文所占分值不如大作文高,但并不代表着它就不重要,往往小作文写得好坏足以影响后面大作文发挥的 心情 和状态。那么怎么样写好一篇小作文呢?首先我们要确定所谓小作文究竟有哪些?其实就是两大类:主流类(曲线图、饼状图、柱状图和表格图),非主流类(流程图、示意图和地图)。针对不同的类别我们又不同的写法,但无论怎样都是遵循着游戏规则来的,即官方的四大评分标准:TA(Task Achievement)(任务完成) C&C(Coherence and Cohesion)(连贯与衔接) LR(Lexical Resource)(词汇资源) GR&A(Grammatical Range and Accuracy)(语法范围与精确)。听起来很抽象是不是?我们换成 新航道 给你的捷径就是:三个六选一(选词汇,选句型和选连接)加上一个分段技巧(按内部逻辑关系分段、找最少属性分段和找对比和类比分段)的妙用就可以解决通杀大部分小作文了!再配合着五步解题法,那恭喜你,小作文方面可以独步江湖了!五步解题法,即:看、分、解、定、写。拿到图表以后先看图例和任务要求,再有一个清晰的分段,雅思考官非常注重文章的逻辑性,所以你要有脉络清楚的分段,这是得 高分 的先决条件。然后解构分段后的内容,确定该写和不该写的部分,一篇好的高分作文是非常精炼的,你抠不出来任何多余的部分。其次是定词汇句型和连接,词汇决定句型,再用不同的连接手段将其糅合成多样化的句型搭配。这一切在3分钟内完成,最后剩下15分钟写出字迹工整的一篇180字左右的小作文,并给后面的大作文留出足够的时间和空间。看到此,你是否觉得小作文就是用现成的句型词汇加连接的排列组合了呢?对,雅思官方没有说小作文不能用套用句,它本来就是客观性的描写,所以用上3个六选一何尝不可呢?那么大家是否开始觉得想要试着写写了呢?且看第二阶段。
第二个2.5小时:巩固
曲线图是所有小作文里面最简单和基础的类别,写好了曲线图基本也就掌握了小作文的要领。曲线图又分为一根曲线,两根曲线,三个曲线和四根曲线的模式,其中一根曲线不会考到,两根曲线若干年前考过,三根曲线和四根曲线是目前最容易考的,但无论怎样,曲线图的写法都脱离不了总体趋势描写、起始点、末尾点、最低点、最高点、交叉点和落差。做到这几步,TA部分的分数也就不会低了。剑7Test2的那道题相当具有代表性,请在不看范文的情况下用上面所讲的五部解题法并配合三个六选一的技巧写出第一篇属于自己的小作文。饼状图,顾名思义就是像饼一样的图形中给你不同的属性所占的不同部分,写此文章最关键就是不能写成流水账,任务要求我们要Make comparisons,那么我们就可以从这里入手用同等属性在不同饼里面的上升下降保持不变来定位分段加比较,请注意在选词上面要和曲线图区分开来。同样在剑7Test4里为我们提供了一篇非常好的四个饼的真题,此乃练习之绝佳材料。柱状图完全就是曲线图的变体,横坐标上若是时间或者数字的话我们直接将每根柱子顶端连接后按曲线图的写法写就行了,否则按饼状图的写法写即可。表格图相对来说写法较为综合,怎样在给出的那么多信息中找出最有代表性的写是关键,从横纵轴上入手,发现变量最为丰富的用曲线图和饼状图的混合词汇句型带出对比和描述即可,剩下的非关键信息点不写也罢。写完剑6Test2你会发现你收获很多的!
第三个2.5小时:跃升
写完前面四篇文章你是否发现你的文章和满分范文还是不小的差距?这是很正常的,任何一个没有接触过雅思作文的同学都会经历三个阶段,即不知如何下笔阶段,才思泉涌小作文写成大作文阶段,精炼到无限接近满分范文阶段。所以你现在需要做的事情就是拿起手中的满分范文仔细钻研,发现并找出它细微的小品词,插入语,从句等,以求让自己的文章更加精辟和精炼。下面一个应该解决的就是小作文的第二大类,非主流类的流程图、示意图和地图了。此乃众多 烤鸭 心中的梦魇,其实一样不用害怕,只要你愿意冷静的花上几分钟时间去把它们的图例和内容吃透,并按照要么空间顺序要么时间顺序或者是按照题目要求去写就行了。而且,大部分非主流的小作文会给出足够多的词汇在图上,你只需要利用不同的时间或空间的连接词配合着多样化的句型将其组合起来即可,理论上来说它们比主流类的小作文更加简单!剑6Test3上那道蚕的生长过程以及丝绸的制造步骤便是最好的例证,你会诧异的发现原来满分范文是那么的简单和容易。至于地图题这个逐渐在抬头的题型,剑5Test3上那道开超市的选址题会让你清楚的认识到原来地图题就是分析不同地点的优缺点并加以比较得出自己的结论,虽然它的写法开始有了像大作文偏向的痕迹。总之,非主流毕竟是非主流,以不变应万变乃破此类题之王道!
第四个2.5小时:完善
切记:任何武林绝学拿到以后仍需大量的练习才能笑傲江湖,小作文亦是如此!仅仅只是上面四篇文章还不足以让你轻松自如的面对和锻炼身体控迎面而来的不同题型。那么,借助手中所有的剑3到剑7这五本真题集,把总共20道小作文题目都练习一遍。用五步解题法,借助三大分段技巧和三个六选一将所给图表一层一层剥开重新用最精辟的语言描述出来,再去吸取满分范文的优点和总结考生低分范文的不足。你将来的小作文会让考官眼前一亮的!
1、According to the first graph, it can be seen that ______________, it can also be concluded from it that ______________.
通过第一个曲线图,我们可以知道____,也说明了结果是___
2、There is an interesting and instructive picture which goes like this: __________.
一张有趣、有教育意义的、(内容)的图片(这句模板在雅思小作文中的应用非常的广泛。)
3、Nowadays there is a growing concern over ______________. Many people like ______________, while others are inclined to ______________.
当前有一张涉及______的增长曲线图,许多人______,然而其他人倾向于___
4、Nowadays, it is common to ______________. Many people like______________ because ______________. Besides, ______________.
目前,共同之处是_________,许多人喜欢______因为_______除此之外还由于_____
5、Just like many other things, are preferred by ____________. While being attacked by the idea that ______________, some people consider ______________. They point that ______________.
(图表所示)_____,就像许多其他事物,被____更加喜爱,然而这一观点正被________所抨击,一些人认为_________,他们指出___________ ______________,
6、Everything has two sides and ______________ is not an exception, it has both advantages and disadvantages.
每种事物都有两面性和________,是没有异议的,包括利和弊
7、For years ______________ had been viewed as ______________. But people are taking a fresh look at it now.
_____作为_____被观察了许多年,但是人们现在像发现新大陆一样注视着它
8、It has stipulated by the government that ______________. To this stipulation, many people respond actively because ______________.
政府保证________,对于这份保证,大多数人做出了强烈地回应,因为_____
9、___________ is a common occurrence in our daily life. Whatever we do, ______________ can't be avoided.
_______出现在我们日常生活中是很平常的,无论我们做什么,_______都是不可避免的
10、___________ has become a hot topic among people, especially among the young, and heated debates are right on their way.
_____在人群中已经成为热门话题,特别是在年轻人中,激烈的争论无休止
组合图是雅思小作文里常考的题型之一,其写作非常值得我们深入研究。现专供一组合图(组合图+饼图或pie chart + line chart)写作范例和各位“雅友”一起分享,期望对大家的组合图写作带去一些启发和帮助。
不过,在鉴赏前还是请各位先看图表,并思考以下问题:
* 饼图和曲线图各自展示了什么数据在哪个时间点或段的变化特征?
* 在饼图中,数据总值为多少?它由几部分组成?每一部分各代表什么?各自所占百分比又是多少?百分比从大到小如何排列的?谁最大?谁最小?
* 曲线图有何特征?根据特征,曲线可以分成几段来描述?起点值、终点值、峰值、谷值多少?各自对应的时间点又是什么?
WRITING TASK 1:
You should spend about 20 minutes on this task.
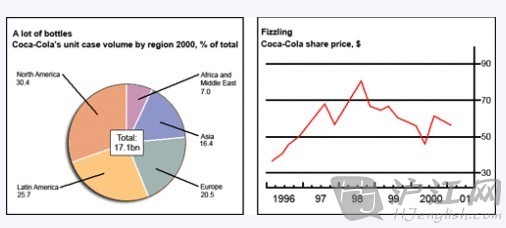
* The chart and graph below give information about sales and share prices for Coca-Cola.
* Summarise the information by selecting and reporting the main features, and make comparisons where relevant.
You should write at least 150 words.
写作范文:
The pie chart shows the worldwide distribution of sales of Coca-Cola in the year 20## and the graph shows the change in share prices between 1996 and 2001.
In the year 2000, Coca-Cola sold a total of 17.1 billion cases of their fizzy drink product worldwide. The largest consumer was North America, where 30.4 per cent of the total volume was purchased. The second largest consumer was Latin America. Europe and Asia purchased 20.5 and 16.4 per cent of the total volume respectively, while Africa and the Middle East remained fairly small consumers at 7 per cent of the total volume of sales.
Since 1996, share prices for Coca-Cola have fluctuated. In that year, shares were valued at approximately $35. Between 1996 and 1997, however, prices rose significantly to $70 per share. They dipped a little in mid-1997 and then peaked at $80 per share in mid-98. From then until 20## their value fell consistently but there was a slight rise in mid-2000.
Writing Task One
You should spend about 20 minutes on this task.
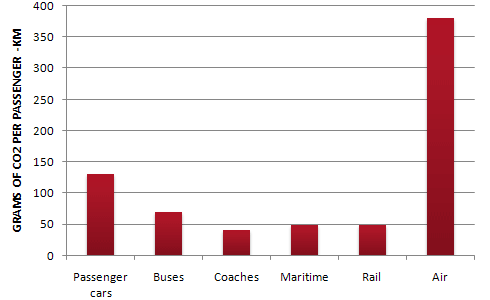
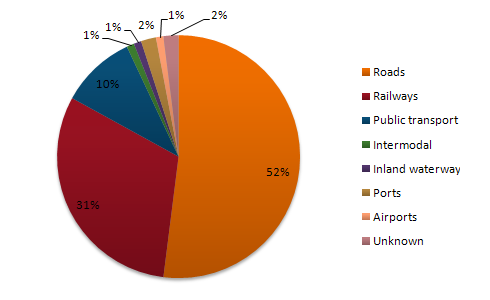
The table below shows CO2 emissions for different forms of transport in the European Union.The Pie Chart shows the percentage of European Union funds being spent on different forms of transport.Write a report for a university lecturer describing the information below.
You should write at least 150 words.
model answer:
The chart shows CO2 emissions per passenger kilometre for variuos methods of transport in the European Union while the pie chart shows European Union spending on transport. Flying by air produces by far the greatest CO2 emissions, approximately three times as much as passenger cars which are the next largest producers. Very little is spent by the EU on air travel while roads make up more than half of the EU transport budget.
Trains produce about three times less CO2 emissions per passenger kilometre than passenger cars and eight times less than air travel. Nearly a third of EU transport funds are spent on railways.
Ships are a clean form of transport and produce about the same amount of CO2 per passenger kilometre as trains do. However, only 2 percent of EU funds are spent on ports. A further one percent is spent on inland waterways.
Coaches are the cleanest form of transport. Emissions of CO2 per passenger kilometre from coaches are half those of buses. Buses emit less than half as much CO2 per passenger kilometre as cars. The European Union spends 10 percent of its transport budget on public transport, such as buses and coaches.
(197 words)
老外写的小作文范文, 比较直观~~
第一篇
作文题目
第一篇 范文参考
model answer:
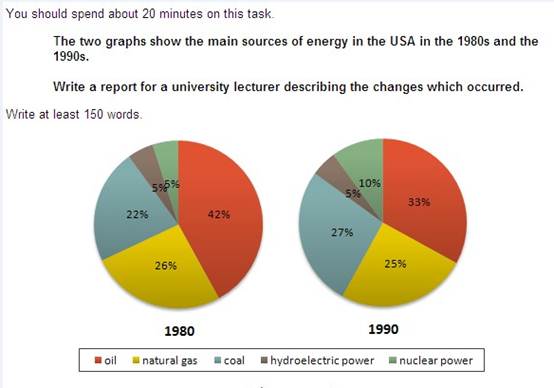
The two graphs show that oil was the major energy source in the USA in both 1980 and 1990 and that coal, natural gas and hydroelectric power remained in much the same proportions. On the other hand, there was a dramatic rise in nuclear power, which doubled its percentage over the ten years.
Oil supplied the largest percentage of energy, although the percentage decreased from 42% in 1980 to 33% in 1990. Coal in 1990 was the second largest source of energy, increasing its proportion to 27% from 22% in the previous decade. Natural gas, the second largest source in 1980 at 26%, decreased its share very slightly to provide 25% of America’s energy ten years later. There was no change in the percentage supplied by hydroelectric power which remained at 5% of the total energy used. Nuclear power the greatest change: in 1990 it was 10%, twice that of the 1980s.
(152 words)
第二篇
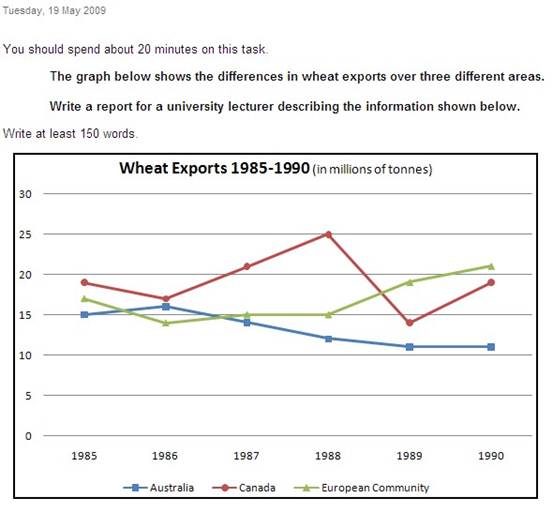
第二篇答案参考
model answer:
The three graphs of wheat exports each show a quite different pattern between 1985 and 1990. Exports from Australia declined over the five-year period, while the Canadian market fluctuated considerably, and the European Community showed an increase.
In 1985, Australia exported about 15 millions of tonnes of wheat and the following year the number increased by one million tonnes to 16 million. After that, however, there was a gradual decline until 1989 and 1990 when it stabilised at about 11 million tonnes. Over the same period, the amount of Canadian exports varied greatly. It started at 19 million tonnes in 1985, reached a peak in 1988 of 24 million, dropped dramatically in 1989 to 14 million tonnes and then climbed back to 19 million in 1990. Seventeen million tonnes were exported from the European Community in 1985, but this decreased to 14 million tonnes in 1986 and then rose to 15 million in 1987 and 1988 before increasing once more to 20 million in 1990.
(165 words)
第三篇(流程图哦,必看必看)
You should spend about 20 minutes on this task.
The flowchart illustrates the production of coloured plastic paper clips in a small factory.
Write a report for a university tutor describing the production process.
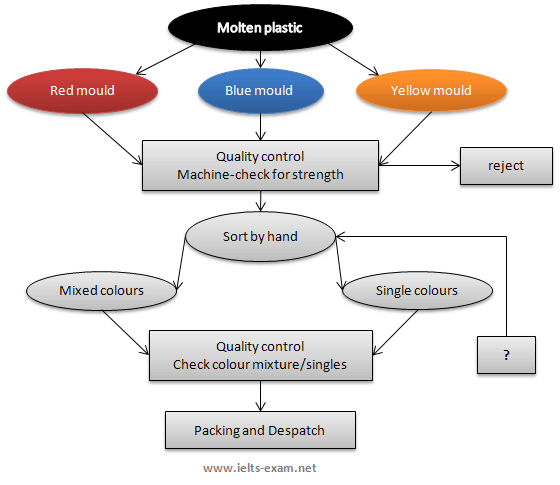
第三篇 model answer
There are four main stages in the production of plastic paper clips from this small factory. Two of these stages involve actual preparation of the clips, while the other two consist of quality control before the clips are sent out from the factory to the retailers to be sold to the public.
To begin with, molten plastic is poured into three different moulds depending on the colour required; the colours are red, blue and yellow. Once these clips emerge from the moulds a quality control machine checks them for strength. Unsatisfactory clips are rejected. In the third stage in the process the clips are stored by hand into two groups, mixed and single colours. When this stage is complete the groups are checked a second time to ensure that the colour mixtures are divided correctly into single colours and mixed colour batches. Finally, the clips are packed and dispatched to the markets.
(152 words)
第四篇 表格题
You should spend about 20 minutes on this task.
The table below give information about Favorite Pastimes in different countries.
Summarise the information by selecting and reporting the main features, and make comparisons where relevant.
Write at least 150 words.
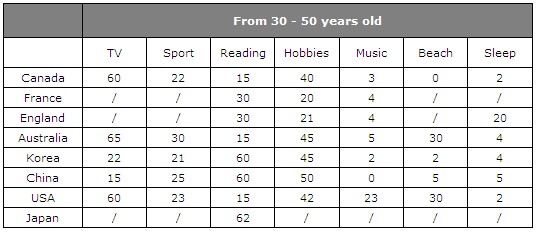
第四篇参考答案
model answer:
This table clearly presents and compares favorable pastimes in eight different countries. The pastimes, across the top of the table, are analyzed in relation to each country.
As can be seen, about 60% of Canadians, Australians and Americans like watching television. On the other hand, this figure is quite low for China where only 15% of people watch television. Predictably, Americans like music at 23%, whereas only 2 to 5% of people in the other countries feel the same way. 20% of people in England enjoy sleeping as a pastime whereas in Canada and the USA, for example, the figure is only 2%. Interestingly, the Chinese like hobbies the most at 50%, as opposed to only 20% in France. It isn’t surprising that the highest percentage of beach-lovers is in Australia and the USA at 30%.
It seems that pastimes of people of different nationalities may be influenced by a number of factors such as the socio-economic situation or the climate. These factors influence cultural differences between different nationalities and make cross-cultural experiences more interesting.
(175 words)
第五篇
You should spend about 20 minutes on this task.Write a report for a university lecturer describing the information shown below.You should write at least 150 words.
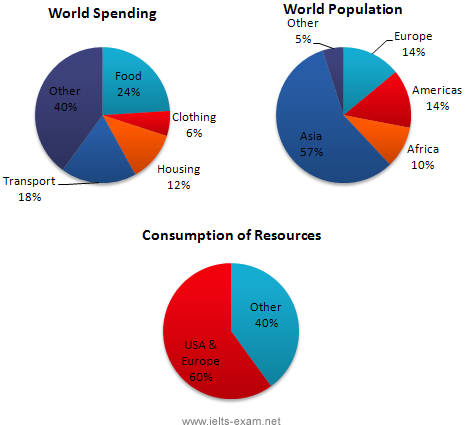
第五篇参考答案
In this analysis we will examine three pie charts. The first one is headed ‘World Spending.’ The second is ‘World Population’ and the third is ‘Consumption of Resources.’
In the first chart we can see that people spend most of their income (24%) on food. In some countries this percentage would obviously be much higher. Transport and then housing are the next major expenses at 18% and 12% respectively. Only 6% of income is spent on clothing.
In the second chart entitled ‘World Population’, it is not surprising to find that 57% of people live in Asia. In fact China and India are two of the most populated countries in the world and they are both situated on this continent. Europe and the Americans account for nearly 30% of the total, whilst 10% of people live in Africa.
Finally, the third chart reveals that the USA and Europe consume a huge 60% of the world’s resource.
To sum up, the major expenditure is on food, the population figures are the highest for Asia and the major consumers are the USA and Europe.
(182 words)
第六篇
You should spend about 20 minutes on this task.
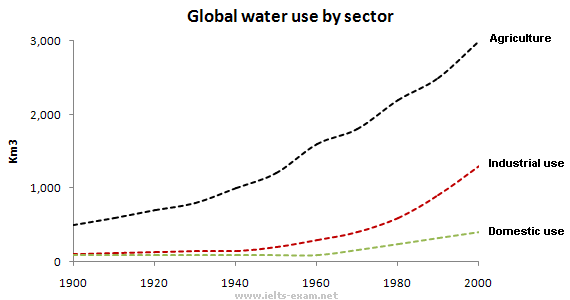
The graph and table below give information about water use worldwide and water consumption in two different countries.
Summarise the information by selecting and reporting the main features, and make comparisons where relevant.
Write at least 150 words
第六篇参考答案
The graph shows how the amount of water used worldwide changed between 1900 and 2000.
Throughout the century, the largest quantity of water was used for agricultural Purposes, and this increased dramatically from about 500 km3 to around 3,000 km3 in the year 2000. Water used in the industrial and domestic sectors also increased, but consumption was minimal until mid-century. From 1950 onwards, industrial use grew steadily to just over 1,000 km3, while domestic use rose more slowly to only 300 km3, both far below the levels of consumption by agriculture.
The table illustrates the differences in agriculture consumption in some areas of the world by contrasting the amount of irrigated land in Brazil (26,500 km3) with that in the D.R.C. (100 km2). This means that a huge amount of water is used in agriculture in Brazil, and this is reflected in the figures for water consumption per person: 359 m3 compared with only 8 m3 in the Congo. With a population of 176 million, the figures for Brazil indicate how high agriculture water consumption can be in some countries.
-
雅思小作文技巧及范文
雅思小作文写作技巧及范文一图表类型饼状图直方图或柱形图趋势曲线图表格图流程图或过程图程序图二解题技巧A表格图1横向比较介绍横向各个…
-
雅思小作文范文
IELTS套句式写作大全第一部分TASK1图表写作套句精选1thetableshowsthechangesinthenumbero…
-
老外的标准雅思小作文范文(分享)
第三节观点之间的连贯Firstlyprimarilyinitially其他参考vThefirstandmostimportantt…
-
【雅思小作文】组合图(曲线图+饼图)写作范例
组合图是雅思小作文里常考的题型之一其写作非常值得我们深入研究现专供一组合图组合图饼图或piechartlinechart写作范例和…
-
雅思小作文模版
开头1Thisgraphpiecharttablebarchartreflectstheratepercentageproport…
-
雅思table小作文范文总结
Thetablebelowshowstheproportionofdifferentcategoriesoffamilieslivinginpover…
-
雅思小作文万能模板小结
httpbailieducom从评分标准看提高雅思大作文如何才能取得雅思写作高分是很多同学苦苦思索的问题却一直不得其解其实要想获取…
-
雅思小作文范文
IELTS套句式写作大全第一部分TASK1图表写作套句精选1thetableshowsthechangesinthenumbero…
-
雅思小作文技巧及范文
雅思小作文写作技巧及范文一图表类型饼状图直方图或柱形图趋势曲线图表格图流程图或过程图程序图二解题技巧A表格图1横向比较介绍横向各个…
-
雅思小作文范文
IELTS套句式写作大全第一部分TASK1图表写作套句精选1thetableshowsthechangesinthenumbero…
-
雅思小作文饼状图写作范例、思路、常用句式
雅思小作文饼状图一例Manywomenwantorneedtocontinueworkingaftertheyhavechildr…