篇一 :英语四级看图作文专项练习及范文
◆看图作文
27.Directions:
A. Study the following set of pictures carefully and write an essay in no less than 120 words.
B. Your essay must be written clearly on the ANSWER SHEET Ⅱ.
C. Your essay should cover all the information provided and meet the requirements below:
1. Interpret the following pictures.
2. Predict the tendency of tobacco consumption and give your reasons.
…… …… 余下全文
篇二 :四级看图作文模板
第一段:图画描述段的写法
三至四句(50-55词):
1. General description:套话+总体描述
寻找出图画的中心事物,确定中心事物的位置,从动作和状态两方面来描述画面中的中心事物;
2. Details:挖掘细节词,联结成句
寻找中心事物周围相关的事物,并进行简单的描述 ( 细节描述)
3.Caption:文字说明+段尾套话过渡
若图画下方有 caption,可将其翻译为英语。
图片作文:描述3-4句,寓意1,分析4句,评论4句
关键:仔细分析,观察细节,把握寓意,联系现实,丰富表达
方法:第二段和第三段开头是主题句
步骤:
第一段(3-4句)引言,图画描述。主要是描述图片中的信息和表达的含义。
第一句:总体描述:人物、动物、事物+动作+环境: 1句
第二句:挖掘细节此、串连成句:1-2句
第三句:文子说明、象征寓意:1句
第二段(5句)主题段,意义阐述。是全文的重点,指出现象的寓意及分析其原因。 第一句:主题句:象征寓意:1句
第二句-第四句:论证(因果论证,举例论证,联系现实,正反论证)
第五句:小结:概括论证,总结本段:1句
…… …… 余下全文
篇三 :20xx英语四级看图写作模板
写作部分
Picture , cartoon, table, chart, graph
一、图表作文
试题[1]The graph shows the cheese sales in the country X in the year 1997. Look at the graph and write a composition of about 120 words making reference to the following points.
1. The distribution of percentage by Cheese Type;
2. Possible reasons for Cheddar Cheese’s largest share in sales
第一段
范例The pie graph gives information about cheese sales in the country X in the year 1997. After carefully studying the information in the graph, we may safely conclude that Cheddar cheese and Mozzarellar cheese shared the better part of the market, with Cheddar cheese taking the lead by occupying 36 percent and Mozzarellar occupying 30.6 percent of the total market share.
…… …… 余下全文
篇四 :四级看图作文
英语四级图表作文讲解及参考范文
图表作文也是四(六)级考试中常见,而且被认为是一种较难的作文形式。图表作文就是把非文字信息(通常为各种图表表示的数字信息等)转换成文字信息的一种作文。它要求我们用文字来描述非文字性的图表或对图表显示的关系作解释说明。
第一节 图表作文的出题形式和写作要领
一、图表作文常见出题形式
图表作文一般在题目中给出作文的标题和一个或几个统计表格、圆形图、曲线图或条形图,有时还用英文或中文提纲的形式给出提示,要求我们:
1)用文字描述图表,客观解释图表中所传递的信息,并找出某种规律或趋势;
2)就图表中所反映的某种趋势或问题分析其原因或后果。
图表作文着重说明事实,常常是通过对图表中所反映的具体数据的说明、分析、比较,对某种事物或现象的事实或变化情况等加以说明,并提出结论或看法。因此,图表作文常常采用议论文体的写作方法。
写好图表作文,关键在于能否读懂图表中所提供的信息,把握各信息间的联系,用准确流畅的语言把这一信息表达出来,并就这一信息发表自己的看法。
二、图表作文的写作步骤
写图表作文时,要注意遵循以下步骤:
1)认真分析图表的含义,弄清图表中所含的信息及不同信息间的关系;
…… …… 余下全文
篇五 :英语四级看图英语作文万能模板
1.看图英语作文万能模板
第一段:描述图画
1、 As is vividly shown in the picture( 如果两个的话用pictures,也可以用drawing,同样的如果两个的话用drawings,如果是图表则用table,两个图表则用 tables) above, 图画的内容。The picture( 如果两个的话用pictures,也可以用drawing,同样的如果两个的话用drawings,如果是图表则用table,两个图表则用 tables) tells ( 注意,如果是前面的图画是复数,则用tell) us that 这个图片的大致反映的意思。
2、 Recent years people in 地名(比如中国、北京、美国等等)have witnessed the fact that 描述图片里的现象, And it is very common/usual to see that in recent years.
第二段:解释,说明和分析图片
1、 The implied meaning of the picture(注意,同上进行单复数的处理) should be taken into account seriously. First/To begin with, 揭示涵义/原因/结果1,Second/What’s more, 揭示涵义/原因/结果2。 Last but not least/Finally, 揭示涵义/愿意/结果3(如果有的话)。And the social problem(如果是现象的话可以用phenomenon) has arisen the great concern/care of our whole society/world/all the people.
…… …… 余下全文
篇六 :专业四级看图作文-样题和范文
图表作文样题与样文举例
样题一:
Directions: For this part, you are allowed 30 minutes to write a composition on the topic How People Spend Their Holidays. You should write at least 120 words, and base your composition on the table and the outline given below:
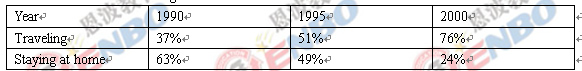
1、 根据上表,简要描述1990年、1995年、20##年某城市人们度假方式的情况及其变化;
2、 请说明发生这些变化的原因;
3、 得出结论。
How People Spend Their Holidays
As is clearly shown in the table that there was a dramatic change in the way people spent their holidays between 1990 and 2000. Especially, in 1990, 63% of people spent their holidays at home, while the figure decreased considerably to 24% in 2000. There are three reasons for this phenomenon.
…… …… 余下全文
篇七 :20xx年6月四级看图作文万用模板句型使用方法
20##年6月英语四六级图表作文万能模板
这类作文时,注意以下几点:
审题时,除了要把握好图表的表层信息外, 还要分析图标的深层含义,如原因、根源、可能的发展趋势等。图表中所提供的说明文字往往是问题的切入点,一定要仔细分析。
描述数据时要抓住重点,为中心服务,不必面面俱到,切忌毫无目的地罗列图表中的数据。如果数据较多,抓住图表中的极端点(如最大或最小、最多或最少,最好或最差)和基本相同进行描述。
主题句应明确,最好放在文章的开头,这样会使重点突出,主题明了。
常见模板
第一段:总体描述图表,指明时间段,指出突出变化或不同
常用句型或短语:
As is clearly shown in the char/ table/graph, ___________
According to the figures given in the table/chart/graph, ____________
It can be seen from the table/chart/graph, _____________________.
The figures in the table/chart reflect that ________________.
especially, ________________(指出突出变化)
第二段:(分析原因)
There are several factors leading to this change / difference ……..
There are several reasons for _____________.(引出原因)
To begin with, _______(原因一)
In addition, ______________(原因二0
For example, _________(举例说明)
Last but not the least, __________(原因三)
To sum up——————————————(简要总结)
…… …… 余下全文
篇八 :大学英语四级作文范文10篇
大学英语四级作文范文10篇
一 The Advantages and Disadvantages of Living in the 21st century(生活在21世纪的优缺点)
Living in the 21st century offers certain advantages,such as a higher standard of living, but it also has some disadvantages, such as a polluted environment.
To begin with, most people now have more money for less hard work. They earn higher salaries than before and enjoy better social security, such as social welfare for laid-off workers and disability insurance.
Secondly, because of the advance in medical technology which leads to better medical care and treatment, people’s life expectancy is longer. Moreover, most people now can afford to buy foods of high nutrition and enjoy their leisure time.
…… …… 余下全文