专业四级看图作文-样题和范文
图表作文样题与样文举例
样题一:
Directions: For this part, you are allowed 30 minutes to write a composition on the topic How People Spend Their Holidays. You should write at least 120 words, and base your composition on the table and the outline given below:
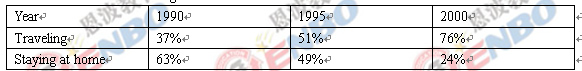
1、 根据上表,简要描述1990年、1995年、20##年某城市人们度假方式的情况及其变化;
2、 请说明发生这些变化的原因;
3、 得出结论。
How People Spend Their Holidays
As is clearly shown in the table that there was a dramatic change in the way people spent their holidays between 1990 and 2000. Especially, in 1990, 63% of people spent their holidays at home, while the figure decreased considerably to 24% in 2000. There are three reasons for this phenomenon.
To begin with, with the development of market-oriented economy, people earn by far more money than they used to, making it possible for them to afford traveling expenses. In addition, people realize the importance of getting well-informed about the outside world in this modern era to develop their potential. For example, a traveler may encounter or talk with someone of a different cultural background so as to broaden his vision. Last but not least, by traveling outside, people are close to nature, which is not only beneficial to both their health and peace of mind. In short, more and more people take the occasion of holiday to travel outside and relax themselves.
As far as I am concerned, I prefer to go traveling instead of staying at home during holidays. On the one hand, I love meeting different people and take in some fresh ideas. On the other hand, it is agreed that the world is becoming a global village. No one could confine himself within his small circle of families or relatives. In brief, I have benefited a lot and will benefit more from traveling during the holidays.
点评:该篇作文属图表作文,命题思路与四级真题图表作文一致,仿真度高。本预测题关于人们旅游度假方式的变化,也是社会热点话题,20##年1月就考过名校校园该不该成为旅游景点话题;20##年6月也是关于旅游景点的介绍。
样题二:
The Pursuit of A Master’s Degree
a. 根据下图描述某校毕业生毕业意向的变化
b. 分析选择读研的毕业生数目增加的原因
c. 说明选择读研对个人和社会产生的影响

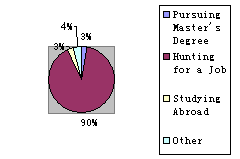
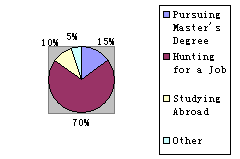
It is illustrated in the pie charts that graduates’ choices after graduation have experienced much change. The number of students choosing to pursue a master’s degree and study abroad grows several times over the decade.
The reasons of the increasing number of students pursuing a master’s degree are as follows. First, with the number of college graduates growing each year, the situation in the job market is getting tighter and tighter. The public awareness of the situation has created a surge of interest in seeking a master’s degree. Secondly, many cross-national companies set a much higher standard for new recruits than ever. It seems that the higher education you have, the higher salary you may receive.
Choosing to study for master’s degree will benefit the individuals and the whole society as well. The quality of Chinese intellectuals will be considerably enhanced, which in turn will boost the progress of the whole society.
样题三:
Direction: For this part you are allowed 30 minutes to write a composition on the topic :Cell Phones .You should write no less than 120 words and base your composition on the outline below:
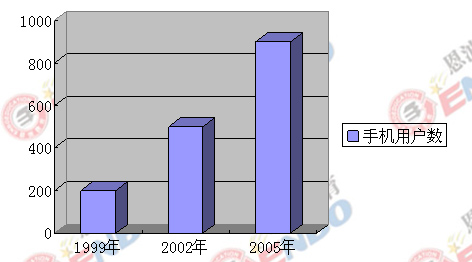
1. 描述上图所示的手机用户数的变化情况
2. 出现这种情况的原因
3. 对此现象作出评价
Cell Phones
As is shown in the chart, cell phones are becoming increasingly popular within China. In 1999, the number of cell phones in use was only 2 million, but in 2002, the number reaches 5 million. And in the year 2005, the number has suddenly soared to 9 million.
There are many factors contributing to this development. Firstly, a cell phone has no wires and can be carried everywhere easily. Secondly, a cell phone is something wonderful that we can have fun with news, games, music and chat through sending short messages. Thirdly, the drop in price and the simultaneous improvement in the functions have made it possible for an average person to make use of cell phone.
The wide use of cell phones has make them more and more indispensable in people’s daily life. The many functions of the cell phone have made certain people reluctant to separate themselves from their cell phone.
点评:随着我国经济的快速发展,人民的生活水平不断改善,通讯业的日新月异的发展,使得手机使用普及化,成为人们日常生活的必需品,对此的利弊人们看法各异。本预测题为热点话题,同样是年轻人较熟悉和经常讨论的话题,值得关注。
样题四:
Directions: For this part, you are allowed 30 minutes to write a short essay entitled Blog. You should write at least 120 words based on the chart and outline given below:
下图是20##年1-10月中国博客服务人均月度有效浏览时间及增长率,描述变化,说明原因。

Blog
This histogram (柱状图;直方图)shows the number of people using blog services from January to October in 2007. From it we can see that the number of users increased monthly from January to August, except February. After two peak months, July and August, the number dropped slightly in September, while in October it picked up again.
Possible reasons for these changes are first, in February Chinese people celebrated the most important festival——Chinese New Year. This means more people spent more time with their families and friends, and therefore they didn’t have as much time for surfing online. Secondly, college students are the main users of blog services. While in July and August,they had summer holidays, which enabled them to have more spare time reading and writing blogs. Thirdly, with improvements of blog services and the influence of some “star bloggers”, most of whom are celebrities, blogs are becoming an important way for people to express themselves and communicate with others. So more and more people are starting to use these services, which help explain the overall increase shown here.
点评:这是一篇图表题。 可以看出,整体呈增长趋势。但是,二月和九月有所下降。所以,分析的时候要照顾各个方面。
样题五
For this part, you are required to write a composition about 120 words on the topic: Changes in People’s Daily Expenses. Your composition should be written on the following table and Chinese given below.
1. 描述图表中人们每天开支变化情况
2. 请说明发生这些变化的原因
3. 结合图表对未来作出合理的预测
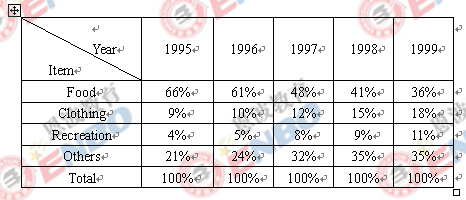
Changes in People’s Daily Expenses.
What is shown in the table above indicates that dramatic changes have taken place in the people’s daily expenses from 1995 to 1999. The expenses on food have declined by 30% while those on clothing and recreation have increased respectively by 9% and 7% . The statistics of rise and fall seem to exist in isolation but closely related to one another .
There are two factors accounting for these changes. Development in economy is an essential one in the five years. The increased income resulting from economic growth plays an important part in the less expense on food. Hence, a small percentage of total income is enough to cover food expense. Another one is the changes in life style. When food presents no worry to the average, people begin to focus more of interest on handsome appearance and happy leisure time . As a result of such a shift, spending on clothing and recreation increases year after year.
From the analyses made above, we may come to the conclusion that people’s living standards have been constantly improved between 1995 and 1999. With the further growth in economy and more changes in life style, the tendency indicated in the table will continue in the better direction .
点评:该预测题属于图表作文写作,与社会生活密切相关,与1991年6月份四级考试人们饮食结构的变化图表作文写作类似。根据四级图表作文命题规律,第一段描述人们1995到1999年日常开支所发生的巨大变化;第二段分析产生变化的原因;最后一段依据图表所示变化作出了合乎逻辑的预测。文章紧扣主题,条理清楚,语言连贯,表述准确规范,结论合理。
样题六
Changes in the Ownership of Houses (2003.6)
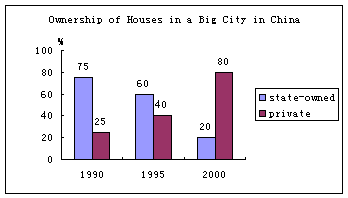
要求:1、根据上图描述该市住房产权的变化;
2、分析产生这些变化的原因;
3、说明这些变化对个人和社会产生的影响。
Changes in the Ownership of Houses
As is shown in the chart, great changes have taken place in the ownership of houses in the city. There has been a steady decline in the percentage of state-owned houses from 75 in 1990 to 20 in 2000. On the contrary, the percentage of private houses has been on the rise.
Several factors may account for the trend. For one thing, owing to the policy of reform and opening to the outside world, the past decade witnessed significant improvement in people’s standard of living. In other words, they have had the means to purchase houses of their own. For another, people’s ideas about consumption have undergone some radical changes. In the past, they were reluctant to spend, but now they are willing to buy. Anyway, it is much more comfortable to dwell in a house of one’s own.
These changes in the ownership have already had a positive effect on both individuals and society. Individuals, young people in particular, will be motivated to work harder to purchase a nest of their own. As a result, the housing industry will be boosted and more revenues will be raised to cover other sectors of our national economy.
-
日语专业四级作文模板
一正反对比类4-3-3(第一段四句,第二段三句,第三段三句)第一段:引入话题1Amongallthepopularissueswh…
-
英语专业四级作文范文
范文1论人生态度Justasisrevealedinthepicturesabovepeoplearegenerallyclass…
-
专四作文范文
范文1论人生态度Justasisrevealedinthepicturesabovepeoplearegenerallyclass…
-
专四作文范文
WriteonANSWERSHEETONEacompositionofabout200wordsonthefollowingtopicNowadays…
-
专四作文范文
一短文写作大作文1题目AcademicDishonestyonCampus观点表达型写作要求Recentsurveysshowth…
-
20xx年6月大学英语四级作文真题及范文
20xx年6月大学英语四级考试作文真题及范文HowWillOurLifeGoonwithoutInternetIfaskedwhe…
-
大学英语四级作文_十大必备范文
四级写作网络课堂十大必背范文1网络游戏DirectionsForthispartyouareallowed30minutestow…
-
20xx年四级英语作文范文_(新东方)
20xx四级写作网络课堂十大必背范文1网络游戏DirectionsForthispartyouareallowed30minute…
-
历年英语四级真题作文范文汇总
历年英语四级真题作文范文汇总20xx年12月大学英语四级作文真题DirectionsForthispartyouareallowe…
-
20xx年大学英语四级作文范文精选
20xx年大学英语四级作文范文精选20xx年大学英语四级作文范文心理健康Forthispartyouareallowed30min…