六级之图表作文模板
图表作文
图表是科学文献中常用的一种表达手段。四六级图表作文利用图形(figure)、表格(table)、曲线图(graph)、柱状图(pie chart)和饼状图(pie chart)等作为写作提示,并以此为依据要求用简洁生动的语言把图标中所给出的信息完整而准确地表达出来。
这一类作文通常前半部分说明图标所表达的信息,后半部分进行议论,不论以何种方式出现,图标作文还是遵循一定的模式。最常见的模式是:第一段:描述现状。简要地描述图表,概括图表所表现的社会问题。 第二段:分析原因。剖析图表所反映的深层次问题。用图表来论证第一段提出的主题, 或者分析各个数据产生的原因。第三段:结论和启示。从图表中所体现的现象获得结论或者启示,或者对图标所表现的趋势加以预测。
图表作文模式
①As is shown/depicted/described in the picture/chart, 概括图表内容。 ②For one thing, 支持这一内容的一个方面。 ③For another, 支持这一内容的另外一个方面。④It is obvious that图表所反映的内容。
⑤Many remarkable factors contribute to主题。 ⑥First of all, 理由一。⑦In addition, 理由二。⑧Thirdly,理由三。
⑨Considering all these, I believe that我的看法或偏好。⑩First of all, 个人看法的依据一。⑾Furthermore, 个人看法的依据二。⑿Therefore, 个人的结论或文章的结论。
Example
As is shown in the chart, the number of Chinese people traveling abroad increased gradually. For one thing, in 2001, the number of people traveling abroad was seven point five million, which was increased to ten million in 2002. For another, in 2003, there were twelve point one million Chinese people traveling abroad. It is obvious that China is witnessing an ever prosperous overseas tourism.
The reasons of the increase lie in several aspects.First of all, with the implementation of China’s reform and opening policy, china’s economy has been growing rapidly and steadily. In addition, people’s income has increased tremendously, so more and more people are now eager to see the outside world with their own eyes. Thirdly, the Chinese government has been simplifying the formalities of traveling abroad and has opened more overseas tourist destinations.
As I understand, more and more Chinese people want to travel abroad. One the one hand, at present most people can afford the fees traveling abroad. On the other hand, youngsters especially young couples treat traveling abroad as a new fashion. In conclusion, in light of the development trend of the Chinese economy, the number of outbound travelers in the future will keep increasing.
描写图表和数据的句型
1. 篇首
As we can see from the chart/ As is shown in the table/ According to the table, the price of oil increased dramatically.
The figures in the chart reflect that/ The statistics show that/The numbers in the graph reveal that people’s income has been increasing steadily.
The graph suggests/shows/indicates/illustrates that there has been a sharp decline/rise in the population in this region.
It’s clear/apparent that the output of this type of products is rising/dropping.
2. 数据变化常用句型
数据的增长
The number of ….has grown steadily /has risen from / climbed / went sharply up /soared/ tends to go up / tends to increase….
There was a rapid/sharp /dramatic/gradual/slow increase/rise in the number of students.
The number of students is on the rise/on the increase.
数据的降低
The number of … dropped steadily from / declined suddenly / fell/ tends to go down/ shows a tendency to decrease….
There is a sharp fall/ gradual decrease/ sudden reduction / slow decline / drop ..in the number of ..in 2006.
数据的持平
In 2006, the number of … remain the same /steady /stable / constant /level.
There was little change/hardly any change in the number of between …and …/
There was a slight fluctuation in the number of .. from … to…
表示比较级、倍数、比例关系
be in direct ratio to/with 成正比 be in inverse ratio to/with 成反比
have the largest percentage /proportion of 占最大比例
the number of .. makes up /takes up / accounts for fifty percent of the total.
占总量的50%
Compared with…, … has a higher / lower percentage
与。。。相比, 。。 所占的百分比较大、较小。
.. is twice/ three times as ….as …/ that of …
Double
Treble
The situation reached a peak at …… 于。。。 达到最高值
3. 结论
From the analysis above / From the data, we can conclude that/ we can draw / come to the conclusion that….
According to the information gathered above, we may reach the conclusion that….
We can make a conclusion from the above that….
Homework
Please write a composition on the topic: Annual Expenses on Learning English. You should write at least 150 words, and based your composition on the chart and the outline given below in Chinese:
某城市大学生购买英语资料比例图

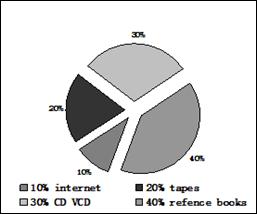
该城市大学生购买英语资料的年人均投入

1) 上图为某城市90年代初和20##年大学生购买英语资料的变化图,请描述图表内容。
2) 解释发生以上变化的原因。
3) 我的看法。
第二篇:六级之图表作文模板
图表作文
图表是科学文献中常用的一种表达手段。四六级图表作文利用图形(figure)、表格(table)、曲线图(graph)、柱状图(pie chart)和饼状图(pie chart)等作为写作提示,并以此为依据要求用简洁生动的语言把图标中所给出的信息完整而准确地表达出来。
这一类作文通常前半部分说明图标所表达的信息,后半部分进行议论,不论以何种方式出现,图标作文还是遵循一定的模式。最常见的模式是:第一段:描述现状。简要地描述图表,概括图表所表现的社会问题。 第二段:分析原因。剖析图表所反映的深层次问题。用图表来论证第一段提出的主题, 或者分析各个数据产生的原因。第三段:结论和启示。从图表中所体现的现象获得结论或者启示,或者对图标所表现的趋势加以预测。
图表作文模式
①As is shown/depicted/described in the picture/chart, 概括图表内容。 ②For one thing, 支持这一内容的一个方面。 ③For another, 支持这一内容的另外一个方面。④It is obvious that图表所反映的内容。
⑤Many remarkable factors contribute to主题。 ⑥First of all, 理由一。⑦In addition, 理由二。⑧Thirdly,理由三。
⑨Considering all these, I believe that我的看法或偏好。⑩First of all, 个人看法的依据一。⑾Furthermore, 个人看法的依据二。⑿Therefore, 个人的结论或文章的结论。
Example
As is shown in the chart, the number of Chinese people traveling abroad increased gradually. For one thing, in 2001, the number of people traveling abroad was seven point five million, which was increased to ten million in 2002. For another, in 2003, there were twelve point one million Chinese people traveling abroad. It is obvious that China is witnessing an ever prosperous overseas tourism.
The reasons of the increase lie in several aspects.First of all, with the implementation of China’s reform and opening policy, china’s economy has been growing rapidly and steadily. In addition, people’s income has increased tremendously, so more and more people are now eager to see the outside world with their own eyes. Thirdly, the Chinese government has been simplifying the formalities of traveling abroad and has opened more overseas tourist destinations.
As I understand, more and more Chinese people want to travel abroad. One the one hand, at present most people can afford the fees traveling abroad. On the other hand, youngsters especially young couples treat traveling abroad as a new fashion. In conclusion, in light of the development trend of the Chinese economy, the number of outbound travelers in the future will keep increasing.
描写图表和数据的句型
1. 篇首
As we can see from the chart/ As is shown in the table/ According to the table, the price of oil increased dramatically.
The figures in the chart reflect that/ The statistics show that/The numbers in the graph reveal that people’s income has been increasing steadily.
The graph suggests/shows/indicates/illustrates that there has been a sharp decline/rise in the population in this region.
It’s clear/apparent that the output of this type of products is rising/dropping.
2. 数据变化常用句型
数据的增长
The number of ….has grown steadily /has risen from / climbed / went sharply up /soared/ tends to go up / tends to increase….
There was a rapid/sharp /dramatic/gradual/slow increase/rise in the number of students.
The number of students is on the rise/on the increase.
数据的降低
The number of … dropped steadily from / declined suddenly / fell/ tends to go down/ shows a tendency to decrease….
There is a sharp fall/ gradual decrease/ sudden reduction / slow decline / drop ..in the number of ..in 2006.
数据的持平
In 2006, the number of … remain the same /steady /stable / constant /level.
There was little change/hardly any change in the number of between …and …/
There was a slight fluctuation in the number of .. from … to…
表示比较级、倍数、比例关系
be in direct ratio to/with 成正比 be in inverse ratio to/with 成反比
have the largest percentage /proportion of 占最大比例
the number of .. makes up /takes up / accounts for fifty percent of the total.
占总量的50%
Compared with…, … has a higher / lower percentage
与。。。相比, 。。 所占的百分比较大、较小。
.. is twice/ three times as ….as …/ that of …
Double
Treble
The situation reached a peak at …… 于。。。 达到最高值
3. 结论
From the analysis above / From the data we gathered from the above graph, we can conclude that/ we can draw / come to the conclusion that….
According to the information gathered above, we may reach the conclusion that….
We can make a conclusion from the above that….
Homework
Please write a composition on the topic: Annual Expenses on Learning English. You should write at least 150 words, and based your composition on the chart and the outline given below in Chinese:
某城市大学生购买英语资料比例图

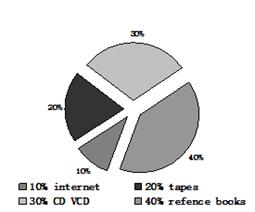
该城市大学生购买英语资料的年人均投入

1) 上图为某城市90年代初和20##年大学生购买英语资料的变化图,请描述图表内容。
2) 解释发生以上变化的原因。
3) 我的看法。
-
帮助大家更好准备英语四六级图表作文
帮助大家更好准备英语四六级图表作文,现给大家提供“英语六级考试图表作文的常用词”总结,希望对你们考试有帮助!1.有用的词上升:in…
-
20xx年6月英语六级作文模板范文:图表型
20xx年6月英语六级作文模板范文图表型六级英语写作所占分值较大对广大考生提出的要求也相对较高从考查要求来看写作部分不但考查了考生…
-
六级之图表作文模板
图表作文图表是科学文献中常用的一种表达手段四六级图表作文利用图形figure表格table曲线图graph柱状图piechart和…
-
英语六级考试图表作文
为帮助大家更好准备英语六级图表作文现给大家提供英语六级考试图表作文的常用词总结希望对你们考试有帮助1有用的词上升increaser…
-
六级之图表作文模板
图表作文图表是科学文献中常用的一种表达手段四六级图表作文利用图形figure表格table曲线图graph柱状图piechart和…
-
帮助大家更好准备英语四六级图表作文
帮助大家更好准备英语四六级图表作文,现给大家提供“英语六级考试图表作文的常用词”总结,希望对你们考试有帮助!1.有用的词上升:in…
-
大学英语四六级作文总结
大学英语四六级作文一四六级作文试题分类四六级作文从试题角度可以分为现象解释型对比选择型问题解决型观点论证型与应用文五种类型一现象解…
-
大学英语四六级考试写作图表作文模板
英语四级考试写作图表作文模板图表作文模板Ascanbeclearlyseenfromthegraphtablechartgreat…
-
四六级写作预测及范文:图表题
四六级写作预测及范文图表题图表题AstayingathomeBtravelingCdoingsocialinvestigation…
-
20xx英语四级考试图表作文模板
图表作文常用句型Thegraphshowsthat图表显示Fromthechartweknowthat从这张表中我们可知Allth…
-
20xx年12月全国大学英语六级考试作文真题和参考范文
20xx年12月全国大学英语六级考试作文真题和参考范文名师简评20xx年12月20日六级真题写作部分打破了20xx年6月14日六级…