基于单片机的脉搏测量仪的设计开题报告
毕业设计(论文)材料之二(2)

本科毕业设计(论文)开题报告
题目: 基于单片机的脉搏测量仪
的设计
√ 实验研究□论文□ 课 题 类 型:设计□
学 生 姓 名:
学 号:
专 业 班 级:
学 院: 电气工程学院
指 导 教 师:
开 题 时 间 20xx年3月11日
20xx年 3 月11日
开题报告内容与要求
一、毕业设计(论文)内容及研究意义(价值)
随着科技发展的不断提高,生命科学和信息科学的结合越来越紧密,出现了各种新颖的脉搏测量仪器,特别是电子脉搏仪的出现,使脉搏测量变得非常方便。 脉诊在我国已具有2600多年临床实践,是我国传统中医的精髓,但祖国传统医学采用“望、闻、问、切”的手段进行病情诊断,受人为的影响因素较大,测量精度不高。科技的创新,脉搏测试不再局限于传统的人工测试法或听诊器测试法,脉搏测量可利用电子仪器测量出精度更就的数据。 人体脉搏信号中包含丰富的生理信息,也逐渐引起了临床医生的很大兴趣,达到了方便、快捷、准确的测量脉搏的目的。随着电子测量技术的迅速发展,现代电子测量仪器以极快的速度向数字化、自动化的方向发展。制成的脉搏测量仪器性能良好,结构简单,有较好的应用和推广价值。
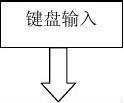
脉搏测量仪的设计,必须是通过采集人体脉搏变化引起的一些生物信号,然后把生物信号转化为物理信号,使得这些变化的物理信号能够表达人体的脉搏变化,最后要得出每分钟的脉搏次数,就需要通过相应的硬件电路及芯片来处理物理变化并存储脉搏次数。在硬件设计中一般的物理信号就是电压变化。本系统的组成包括传感器、信号处理、单片机电路、显示电路、键盘输入等部分。
二、毕业设计(论文)研究现状和发展趋势(文献综述)
随着科学技术的发展,脉搏测量技术也越来越先进,对脉搏的测量精度也越来越高,国内外先后研制了不同类型的脉搏测量仪,脉搏测试不再局限于传统的人工测试法或听诊器测试法,脉搏测量可利用电子仪器测量出精度更就的数据。人体脉搏信号中包含丰富的生理信息,也逐渐引起了临床医生的很大兴趣,达到了方便、快捷、准确在测量脉搏的目的。随着电子测量技术的迅速发展,现代电子测量仪器以极快的速度向数字化、自动化的方向发展。制成的脉搏测量仪器性能良好,结构简单,有较好的应用和推广价值。而其中关键是对脉搏传感器的研究。起初用于体育测量的脉搏测试集中在对接触式传感器的研究,利用此类传感器所研制的指脉、耳脉等测量仪各有其优缺点。指脉测量比较方便、简单,但因为手指上的汗腺较多,指夹常年使用,污染可能会使测量灵敏度下降:耳脉测量比较干净,传感器使用环境污染少,容易维护。但因耳脉较弱,尤其是当季节变化时,所测信号受环境温度影响明显,造成测量结果不准确。过去在医院临床
监护和日常中老年保健中出现的日常监护仪器,如便携式电子血压计,可以完成脉搏的测量,但是这种便携式电子血压计利用微型气泵加压橡胶气囊,每次测量都需要一个加压和减压的过程,存在体积庞大、加减压过程会有不适、脉搏检测的精确度低等缺点。
脉搏测量仪的发展主要向以下几个趋势发展:
(1)自动测量脉搏并且对所得到的脉搏进行自动分析。
目前很多脉搏测量仪都具有检测血氧等其他的功能,但是对这些信号的分析和诊断还需要一些有经验的医生观察,进行分析后才能确认结果,浪费大量的人力,且由人为引入的误差较大。因此,未来脉搏自动检测的内容将更加详细,自动分析诊断功能也更强大。
(2) 数字化技术等先进技术的应用。
随着数字科学技术的发展,脉搏测量仪集成度将更高,更便于携带。数字信号处理的运用将使干扰更小,测量更为准确。
(3)多功能化越来越明显
目前的脉搏测量仪,一般都具有测试血氧,心电图等等功能,单纯的脉搏测量仪已经很少见。随着电子技术的发展,脉搏测量仪必然可以实现更多的功能。
人体脉搏测试仪是用来测量人体心脏跳动频率的电子仪器,也是心电图的主要组成部分。心脏跳动频率通常用每分钟心脏跳动的次数来表示。采用数显式脉搏计测量心脏跳动的频率不但精确,而且使用方便,显示结果醒目。
近年来国内外致力于开发无创非接触式的传感器,这类传感器的重要特征是测量的探测部分不侵入机体,不造成机体创伤,能够自动消除仪表自身系统的误差,测量精度高,通常在体外,尤其是在体表间接测量人体的生理和生化参数。
通过查阅资料发现主要的脉率采集有三种方法:采用一对红色发光二极管实现、采用反射式的红外管实现和采用压电陶瓷芯片实现。 方法一:检测的基本原理:随着心脏的搏动,人体组织半透明度随之改变。当血液送到人体组织时,组织的半透明度减小;当血液流回心脏,组织的半透明度增大。这种现象在人体组织较薄的手指尖、耳垂等部位最为明显。因此,本脉率计将红外发光二极管产生的红外线照射到人体的上述部位,并用装在该部位另一侧或旁边的红外光电管来检测机体组织的透明程度并把它转换成电信号。由于此信号的频率与人体每分钟的脉搏次数成正比,故只要把它转换成脉冲并进行整形、计数和显示,就能实现实时检测脉搏次数的目的。 方法二:采用反射式的
红外管。现在市场上的脉率计普遍采用这种传感器来采集信号,因为此红外管接收和发射都在手指的同一侧,所以就不用考虑每个人手指情况不同所造成的麻烦了。但是同样的,对红外的知识了解相对匮乏,得到需要的信号也不太容易。 方法三:采用压电陶瓷片通过脉搏的跳动采集信号。随着心脏的搏动,人体手腕的脉搏和颈部的搏动较为明显,采用压电传感器放于上述部位,把压电传感器测得的信号转换成脉冲并进行整形、计数和显示,就能实现实时检测脉搏次数的目的。当脉搏跳动时,压电陶瓷片便会产生相应的信号,虽然这是一种很陈旧的方法,但是却很实用,测试的时候能够明显的观测到信号的变化。
人体心室周期性的收缩和舒张导致主动脉的收缩和舒张,是血流压力以波的形式从主动脉根部开始沿着整个动脉系统传播,这种波成为脉搏波。从脉搏波中提取人体的心理病理信息作为临床诊断和治疗的依据,历来都受到中外医学界的重视。脉搏波所呈现出的形态(波形)、强度(波幅)、速率(波速)和节律(周期)等方面的综合信息,在很大程度上反映出人体心血管系统中许多生理病理的血流特征,因此对脉搏波采集和处理具有很高的医学价值和应用前景。但人体的生物信号多属于强噪声背景下的低频的弱信号, 脉搏波信号更是低频微弱的非电生理信号,因此必需经过放大和后级滤波以满足采集的要求。
三、毕业设计(论文)研究方案及工作计划(含工作重点与难点及拟采用的途径)
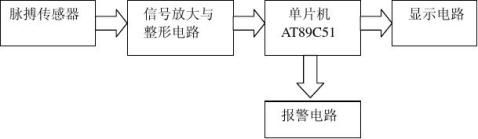
本设计采用单片机AT89C51为控制核心,实现脉搏测量仪的基本测量功能。 系统硬件框图如下图1所示:
图1 脉搏测量仪硬件框图
本设计的难点在软件编码与调试这一部分,软件这部分用C语言编写,C语言编写比较简单,而且看起来脉络清晰,明白,易懂。并且调试、修改起来也比较方便。编写时各个模块可以独立编写,各个模块用一个函数表示,需要时只需调用即可,最后再将各个模块联系起来。当然,各个模块程序的编写还是相当不容易的,需要多查阅资料与学习。重点在硬件设计,硬件设计主要就是各个模块的设计,其关键在于仪器选型和电路设计,如:显示电路用LED显示,键盘主要用于设定脉搏波速上下限,不在此范围,则就报警。这部分也需多查阅资料,多多请教别人,多思考。

四、主要参考文献(不少于10篇,期刊类文献不少于7篇,应有一定数量的外文文献,至少附一篇引用的外文文献(3个页面以上)及其译文)
[1] 程光,赵崇侃.指动脉搏波光电传感器的研制[J].南京医学院学报,19xx年第11卷第4期,329—330.
[2] 朱国富,廖明涛,王博亮.袖珍式脉搏波测量仪[J].电子技术应用,1998,第1期,1—3.
[3] 韩文波,曹维国,张精慧.光电式脉搏波监测系统[J].长春光学精密机械学院学报,1999,第22卷第4期,2.
[4] 欧阳俊,谢定等.基于BL-410 的指端脉搏波采集系统应用研究[J].实用预防医学,2004,第11卷第2期,2—4.
[5] 刘云丽,徐可欣等.微功耗光电式脉搏测量仪[J].电子测量技术,2005,第2期,2—5.
[6] 刘文,杨欣,张铠麟.基于AT89C2051单片机的指脉检测系统的研究[J].医疗装备,2005,第9期,2—14.
[7] 程咏梅,夏雅琴,尚岚.人体脉搏波信号检测系统[J].北京生物医学工程,2006,第25卷第5期,1—3.
[8]李海滨 .单片机技术课程设计与项目实例[M]. 北京:中国电力出版社,2009
[9] J McLaughlin, M McNeill, B Braun and P D McCormack. Piezoelectric sensor determination of arterial pulse wave velocity [M]. UK:INSTITUTE OF PHYSICS PUBLISHING, 2003, 6-4.
[10] J.C.Candy and G.C.Temes.Oversampling Methods for Data Conversion[M].IEEE Pacific Rim conference on Communications,Computers and Signal Processing,May 1991,9-10
[11] John D.Ryder Electronic Fundamentals and Applications[M].1983,1-24.
外文文献:
Piezoelectric sensor determination of arterial pulse wave velocity
Arterial pulse wave velocity (APWV) is a measure of the elasticity (or stiffness) of peripheral arterial blood vessels. The pulse referred to here will be the pressure pulse as opposed to the flow pulse measured by ultrasound Doppler.
The pressure pulse velocity varies over the range from about 12 m s?1 to
15 m s?1 in stiff peripheral arteries, whereas in normal arteries it has a velocity in the range of 7 to 9 m s?1.
The aim of this project was the development of a fast and easy to use system for the determination of peripheral arterial pulse wave velocity. The principle of the PWV measurement is based on simultaneous measurement of two pulse waves at two different positions, such as the radial artery at the wrist and the brachial artery just above the elbow. By determining the pulse transit time between these points and the distance measured between the two locations, pulse wave velocity may then be calculated. The pressure pulse detection is done by using two piezoelectric sensors which generate a measurable voltage at the output contacts if they are mechanically deformed. The deformation produced voltage is first amplified and filtered and then digitalized with a data acquisition card. The analysis of the data obtained from the sensors includes a filtering process, the calculation of the PWV with three different methods— foot-to-foot, cross-correlation and peak-to-peak—and the determination of the arterial pulse rate.
The sensor technique used in this work involves the piezoelectric effect in polyvinylidene fluoride (PVDF), which produces an output voltage in response to mechanical pressure on the material.
Three methods of APWV determination are used: foot-to-foot APWV; peak-to-peak APWV and cross-correlation APWV. The FFAPWV and CCAPWV methods are less sensitive to pressure wave reflections at bifurcations, etc in the arterial tree, than the PPAPWV method. Mean values and standard deviations were computed for all three methods and compared.
‘Foot-to-foot’ APWV (FFAPWV). This is based on the velocity of the ‘foot’, or leading edge, of the pressure pulse wave. The arrival times of the foot of the pulse wave at two positions along the artery are recorded. If Δt is the difference in arrival times and Δs the distance between the two recording positions (proximal and distal), the FFAPWV is simply
FFAPWV = Δs/Δt.
‘Peak-to-peak’ APWV (PPAPWV). This is completely analogous to the FFAPWV
except that the points of observation are the two (proximal and distal) peaks of the pulse wave and
PPAPWV = Δs/Δt.
Apparent pulse wave velocity (AAPWV). The pressure wave may be represented as a Fourier series,
P(t) = P0 +?Pn sin(nωt + θn)
n?1k
Where P0 is the mean fluid pressure, n is the harmonic number, Pn is the amplitude of the nth harmonic and θn is the phase angle of the nth harmonic.
The spatial rate of change of the phase for one harmonic based on two simultaneous pressure measurements separated by a distance _s along an artery, is related to the apparent arterial pulse wave velocity (AAPWV) by the following equation,
AAPWVn = (Δs)n(f )(360o)/(θx1? θx2)
Where AAPWVn is the apparent pulse wave velocity for the nth harmonic, f is the heart rate,θx1 is the phase angle for the proximal harmonic n and θx2 is the phase angle for the distal harmonic n.
Cross-correlation PWV. If the arterial pulse at the proximal measurement position is represented by the pressure time series P(x1, t) and that at the distal position by P(x2, t) and the cross-correlation coefficient is Φx1,x2(τ ), then Φwill have a maximum value at some time lag.
The correlation function can be expressed as
Φx1,x2(τ ) = (1/T )?ε/2
?ε/2P(x1, t)P(x2, t) dt.
The value of τ at which maximum correlation occurs represents the transit time (_t) of the pressure wave from position x1 to position x2 along the arterial segment. From the separation distance and transit time data the correlation arterial pulse wave velocity is
CCAPWV = (x2 ? x1)/ Δt.
In this work normal, young test subjects were used, and it has the primary objectives of optimizing the measurement procedures and establishing the statistical spread and mean values of the observed PWVs for a specific peripheral arterial segment. Based on this, it is planned to use the system in clinical trials involving patients with peripheral arterial disease (due to diabetes, hypertension, etc), pre-, during and post treatment (pharmaceutical or surgical).
Analogue and digital circuitry
Analogue charge amplifier. Piezoelectricmaterials convert mechanical stress or strain into proportionate electrical energy, by producing a charge when subjected to mechanical
stress. The charge is converted to a voltage by an operational amplifier connected as a current integrator, called a charge amplifier. The signal output of the amplifier is approximately ?30 mV. It is augmented by signal amplification.
Analogue signal amplification . This is done by use of an inverting amplifier. Because a dc signal appears at the output of the charge amplifier, dc offset removal is essential and is implemented in the inverting summing
The next phase of the analogue circuitry is a low pass filter to remove the 50 Hz noise interference.
Digital controlled data acquisition and analysis. A data acquisition board (DAQ) is required when the transducer signals need interfacing with a PC. The board contains 12 bit plus sign and a successive approximation and self-calibrating analogue-to-digital (ADC) converter. The ADC incurs a systematic error known as the quantization error. It is due to limited resolution and with the analogue input limit set at ?5 to +5 V, the quantization error of the A/D converter used here was calculated to be 0.122 mV.
The data acquisition and analysis was done using Lab View—a powerful instrumentation and analysis programming language for PCs.
Digital data acquisition program. The data acquisition circuit performs all the necessary operations for the data acquisition with Lab View. The functions of the circuit initialize the data acquisition and read the data from the acquisition card. These data are stored for later use in the data analysis part of the program.
Lab View programs are called virtual instruments (VIs) because of their appearance and operations are analogous to measuring instruments. A VI that is called within another VI is called a sub-VI and is analogous to a subroutine in text-based languages.
The data acquisition, analysis and presentation are comprised of three main procedures:
(1) Data acquisition card to interface the hardware to the PC.
(2) Data acquisition program to acquire and store data in a spreadsheet file.
(3) Data analysis to carry out digital signal processing, calculate PWV and present results.
PWV Calculation
1. PWV calculation using peak detection. To calculate PWV using peaks, the location of the peaks must first be determined, so that the transit time of the wave between the peaks can be determined. It was found that the best method of peak detection is the derivative of the curve method. If the first derivative of a curve is zero, then an extreme value can exist—either a peak or a turning point. It is necessary to take the second derivative at this point—if this is also zero, then an extreme value exists. The second VI used to determine the PWV is PWVcalc, using the time separation between the located peaks.
2. PWV with pressure wave foot detection. The VI named PWV Foot determines the leading edge (foot) of the pressure wave at the upstream and downstream locations. The VI named PWVcalc is again used to compute the PWV from the time separation between the two leading edges (‘foot-to-foot’ APWV or FFAPWV).
3. PWV with cross-correlation. The PWV determination with cross-correlation is done with the VI named CalcPWV. The VI is in two parts: a part for the initialization function and a part for the calculation of the CCAPWV.
In all cases PWV values are assembled in an array and the mean value, standard
deviation and variance are calculated.
Sensor positioning
Sensor placement is critical to obtaining consistent measurements. A screw mechanism was first used to apply the sensors to the skin. But readings were very variable and so this technique was replaced by that in which the sensors are fixed to the skin by elastic strips. This led to better results.
Arm position is another critical feature of measurement. Two positions, normal and dependent, were analyzed in detail, using one test subject. In the normal position, the subject sits with the arm resting on a table. All test subject measurements were made in this position. In the dependent position, the subject sits with the arm hanging straight down.
The PWV values were smaller in this position and the variability was much greater, so this technique was discarded.
A correction module, ‘Delete Incorrect’, was used to delete PWV values resulting from aberrant signals, caused commonly by arm movement during the measurement. These unrealistic values were deleted before the PWV values were passed to the analysis VI.
中文翻译
压电传感器测定动脉脉搏波速度
动脉脉搏波速度(APWV)是一个测量的弹性(或刚度)的外周动脉血管。这里指的脉冲将压力脉冲,而不是流脉冲多普勒超声测量。压力脉冲速度变化范围从12ms?1到15ms?1,而在正常动脉有速度范围,在7到9 ms?1。
这个项目的目标是开发一种快速和易于使用的系统测定外周动脉脉搏波速度。测量仪的原理是基于同时测量两个脉冲波在两个不同的位置,比如桡动脉在手腕和上臂肱动脉略高于肘部。通过测定脉冲过境时间这些点之间和距离测量这两个地点,脉搏波速度可能会被计算。压力脉冲检测是通过使用两个压电传感器产生一个可测量的电压输出联系人如果他们是机械变形。变形产生电压是第一放大和过滤,然后用数据采集卡数字化。分析中获得的数据传感器包括一个过滤过程中,计算有三种不同的方法——foot-to-foot APWV; peak-to-peak APWV 和 cross-correlation APWV。
传感器技术用于这项工作涉及到压电效应在聚偏二氟乙烯(PVDF),它产生一个输出电压响应机械压力对材料。
三种测定动脉脉搏波速度的方法是: foot-to-foot APWV; peak-to-peak APWV and cross-correlation APWV。FFAPWV和CCAPWV方法不敏感,压力波反射在分支等在动脉树,比如PPAPWV方法。平均值和标准偏差是这三种方法分别要计算并比较的。
‘Foot-to-foot’APWV (FFAPWV)。 这是基于压力脉冲波速度的“脚”,或前缘。脚的到达时间的脉冲波在两个位置沿动脉被记录。Δt是到达时间之差和Δs是两个记录位置(近端和远端)之间的距离,FFAPWV是
FFAPWV =Δs /Δt。
‘Peak-to-peak’APWV (PPAPWV)。 这是完全类似于FFAPWV,只是点的观测是脉冲波的两个(近端和远端)的山峰
PPAPWV =Δs /Δt。
Apparent pulse wave velocity (AAPWV)。压力波可以表示为一个傅里叶级数,
P (t) = P0 +?Pn (nωt +θn)
n?1k
P0是流体压力,n是谐波数,Pn是第n次谐波的振幅和相位角的θn是第n次谐波。 空间变化速度的阶段的一个谐波是沿着动脉基于两个同时压力测量距离Δs,与明显的动脉脉搏波速度(AAPWV)由以下方程表示,
AAPWVn = (Δs) n(f)(360 o)/(θx1—θx2)
在AAPWVn是明显的脉搏波速度的第n次谐波,f是心率、θx1是相角为近端谐波n和θx2是相角为远端谐波n。
Cross-correlation PWV.。如果动脉脉冲在近端测量位置代表的压力时间序列P(x1,t)、远端位置P(x2,t)和互关联系数的Φx1,x2(τ),然后有一个最大值Φ将在某个时间滞后。
相关函数可以表示为
Φx1,x2(τ)=(1 / T) ?ε/2
?ε/2P(x1, τ)P(x2, τ)dt。
τ的价值的最大相关性发生代表时间差(Δt)的压力波从位置x1,x2位置沿动脉段。从分离距离和时间数据相关动脉脉搏波速度
CCAPWV =(x2?x1)/Δt。
在这个工作正常,年轻的测试对象被使用,而且它的主要目标优化测量程序和建立统计传播和观测到的PWVs平均值为一个特定的外周动脉段。在此基础上,它是计划利用系统在临床试验中涉及外周动脉疾病患者(由于糖尿病、高血压等)、前、中、后的治疗(药物或手术)。
模拟和数字电路
模拟电荷放大器。压电材料机械应力或应变转换成适当的电能,通过产生一个电荷当受到机械应力。电荷转换成电压通过一个运算放大器连接作为当前积分器,称为电荷放大器。信号输出的放大器是大约30 mV。它增强了信号放大。
模拟信号放大。 这是通过使用一个反相放大器。因为一个直流信号出现在输出的电荷放大器、直流偏移切除是必要的,是实现反相求和下一阶段的模拟电路是一个低通滤波器来去除噪声干扰的50赫兹。
数字控制的数据采集和分析。一个数据采集板(DAQ)时需要传感器信号需要用电脑连接。董事会包含12位加号和逐次逼近和自校准模拟到数字转换器(ADC)。ADC招致一个系统误差称为量化误差。这是由于有限的决议和模拟输入上限设定在?5 + 5 V,量化误差的A / D转换器在这里使用费用为0.122 mV。
数据采集和分析是通过使用虚拟仪器一个强大的仪器和分析编程语言对个人电脑。 数字数据采集程序。 数据采集电路执行所有的必要的操作与虚拟仪器的数据采集。电路的功能初始化数据采集和读取的数据采集卡。这些数据是存储供以后使用的数据分析程序的一部分。
虚拟仪器程序被称为虚拟仪器(VIs),因为他们的外表和操作类似于测量仪器。一个虚拟仪器,被称为在另一个虚拟仪器是称为子虚拟仪器和类似于在基于文本的语言子程序。
数据采集、分析和表示包含三个主要过程:
(1)数据采集卡的接口硬件到PC。
(2)数据采集程序获取和存储数据在一个电子表格文件。
(3)数据分析进行数字信号处理,计算和现在的结果
脉搏波速计算
1.脉搏波速计算使用峰值检测。计算脉搏波速使用峰值,峰值的位置首先必须确定,以便运输时间的波形峰值之间可以确定。最好的方法就是微分峰值检测的曲线求积法。 如果曲线的一阶导数为零,那么一个极端值可以存在要么一个峰值或一个转折点。有必要进行二阶导数在这一点如果这也是零,那么一个极端的价值存在。第二个脉搏波速测量仪是用来确定PWVcalc,使用时间是被测波峰间时间差。
2.与压力波仪脚检测。VI命名仪确定了。脚前缘(脚)的压力波在上游和下游位置。虚拟仪器命名PWVcalc 再次用于计算测量仪两个前缘从时间之间的分离
(“foot-to-foot” APWV或FFAPWV)。
3.脉搏波速与互相关。脉搏波速的测定与互相关完成与VI CalcPWV命名。 VI是两个部分:一个部分是初始化函数和一个部分为计算CCAPWV。
在所有情况下脉搏波速值聚集在一个数组和均值、标准偏差和方差计算。
传感器定位
传感器位置获得一致的测量至关重要。一个螺丝机制是第一次使用的传感器应用到皮肤。但阅读是非常变量,所以这种技术取而代之的是由从传感器固定在皮肤弹性带。这导致更好的结果。
臂位置是另一个关键特性的测量。两个位置,正常的和依赖,都进行了详细分析,使用一个测试主题。在正常位置,这个主题坐着手臂枕在一个表。所有测试主题数据均在这个位置。在相关位置,主体位于手臂垂直悬的。脉搏波速的价值观在这个位置上,小的差异是大得多,所以这技术被丢弃。
一个校正模块,删除不正确的,是用来删除脉搏波速测量仪产生的值异常的信号,通常由臂运动引起的在测量。这些不现实的价值观被删除之前的值被传递给该脉搏波速分析虚拟仪器。
-
基于单片机数字温度计开题报告
云南大学旅游文化学院毕业设计论文开题报告课题名称基于单片机数字温度计设计院系云南大学旅游文化学院信科系专业电子信息工程学号学生姓名…
-
基于单片机的数字温度计设计开题报告
大学综合性设计实验开题报告学生专业同组人指导老师20xx年4月1国内外现状及研究意义随着科技的不断发展现代社会对各种信息参数的准确…
-
开题报告基于单片机的电子体温计的设计
本科毕业设计论文开题报告题目基于单片机的电子温度计的设计课题类型设计实验研究论文学生姓名学号专业班级学院电气工程学院指导教师薛树功…
-
开题报告基于DS18B20数字温度计的设计--
XXXX大学综合电子课程设计开题报告设计项目基于DS18B20的数字温度计的设计指导教师XX专业班级XX级电子信息工程项目负责人X…
-
基于单片机的数字温度计设计
攀枝花学院专业基础综合实验报告基于单片机的数字温度计设计摘要在日常生活及工农业生产中经常要检测温度传统的方式是采用热电偶或热电阻其…
-
物理科学与技术学院研究生论文开题报告和中期汇报的相关要求
物理科学与技术学院研究生论文开题报告和中期汇报的相关要求为切实提高研究生培养质量,加强研究生的开题报告与考核工作,进一步规范研究生…
-
本科毕业论文开题报告范文
本科生的论文开题报告1.论文题目:zno压电薄膜制造瓷砖的研究2.选题意义:2.1理论意义根据当前的物理尖端技术,利用压电陶瓷的特…
-
“关于高中物理有效教学的研究”开题报告
“关于高中物理有效教学的研究”开题报告润安公学物理组一、本课题的选题依据长期以来,高中物理难教难学已经成为不争的事实。究其原因:其…
-
“初、高中物理教学衔接的研究”开题报告
青海师范大学附属第三中学“初、高中物理教学衔接的研究”开题报告一、本课题的选题依据长期以来,高中物理难教难学已经成为不争的事实。究…
- 毕业论文开题报告范文[1]